Nowadays, home staging is an integral part of the home selling process. The impact of home staging is crystal clear, but how you go about it deserves some consideration. Many homeowners will hire a home staging professional, trusting their expertise to make their home as appealing as possible to buyers. However, if hiring a professional isn’t in your budget, taking a DIY approach to home staging can deliver its own benefits.
7 Tips for Staging Your Home Yourself
1. Declutter
The first rule of home staging: make it tidy! A well-staged home should make potential buyers feel comfortable and at ease. To make that happen, it’s important that the spaces in your home are free of clutter. Consider investing in storage bins or a separate storage space temporarily to pare down the items in your home as much as possible.
2. Deep Clean
To really make your home sparkle, it will need more than a cursory cleaning. On top of your usual cleaning routine, get those hard-to-reach and uncommon spots throughout your home that will make it feel spotless. Putting some elbow grease into your bathroom surfaces, underneath and behind furniture, baseboards, and all switches and handles will make a difference when guests enter your home.
3. Fresh Paint
Not only does adding a coat of fresh paint do wonders for the look of your home, it’s a low-cost, high-ROI investment for a DIY project as important as home staging. Going for neutral colors will help to create balance in your interior while appealing to a wide spectrum of buyers’ tastes. It’s the splashes of color on top of a neutral foundation that will help guide visitors’ eyes from room to room.
You only get once chance to make a first impression on potential buyers visiting your home and upping your curb appeal will give you the best chance of wowing them. Take a trip to your local hardware store and prepare to spend some time working in the front yard. Projects that improve the look and quality of your lawn, flower beds, walkways, outdoor lighting, windows, and trim will impress buyers and can increase the value of your home.
5. De-Personalize
Once a buyer pulls up to your property, you want to give them every opportunity to imagine themselves in the home. That’s why it’s important to de-personalize your interior and let them fill it with their own imagination. Remove all family photos, notes, personal gifts, and the like from your home. Aim for a décor style that’s not too ornate and not too bland—think calm, simple, and clean.
6. Focus on Accents
Once you’ve applied fresh paint, boosted your curb appeal, and de-personalized your home, you’re ready to add décor accents. Again, the most important thing is that buyers feel comfortable in your home, so your accents should reflect that notion. Add area rugs that are inviting but not too loud, keep freshly folded towels in the bathroom, and consider adding house plants throughout your spaces to make them feel natural.
7. Design Hacks
A few key design hacks will help you round out your DIY home staging project. If you’re struggling with making the smaller spaces in your home feel comfortable, try adding a mirror. Mirrors help to reflect light and can help narrow or cramped spaces feel bigger. Arrange your living room furniture in a way that emphasizes the room’s dimensions. Since you’re designing your home with open houses in mind, the TV no longer needs to be the focal point of the living room.
For more information on preparing to sell your home, helpful tips on working with an agent, moving checklists, and more, visit our Seller Essentials Home Selling Guide.
Featured Image Source: Getty Images – Image Credit: PC Photography
An integral part of the formula to successfully buying a home is securing the correct amount of financing. Once you’ve found the home you’d like to pursue, one of your primary tasks is exploring different loan products to see which best fits your situation. Eventually, you’ll come to a fork in the road where you’ll need to decide between a fixed-rate mortgage and an adjustable-rate mortgage (ARM). The following information will help you gain a better understanding of ARMs to help you decide whether they’re right for you.
What Is an Adjustable-Rate Mortgage (ARM)?
After your down payment, your mortgage will finance the remainder of your home purchase. Whereas fixed-rate mortgages allow you to lock in a specific interest rate and payment for the life of your loan, adjustable-rate mortgages’ interest rates will fluctuate over time, thus changing your loan payment. It’s typical for ARMs to begin with a low introductory interest rate, but once that first stage of the loan has passed, they will begin to shift up and down. ARMs generally have a cap that specifies the maximum rate that can occur for that loan.
Let’s say you secure an adjustable-rate mortgage with 30-year terms, the first five of which are at a fixed rate. When the variable interest portion of the loan kicks in, your mortgage’s fluctuations will be measured against an index. If the index is higher than when you secured the loan, your rate and loan payment will go up—and vice versa. How often your ARM rates change depends on your agreement with your lender. Talk to your mortgage broker to learn more about the characteristics of adjustable-rate mortgages.
Different Types of Adjustable-Rate Mortgages (ARMs)
Payment-Option ARM: You’ll have flexibility to choose your monthly payments with a payment-option ARM, including interest-only payments and minimum payments that don’t cover interest. These loan products can get home buyers into hot water quickly when rates increase.
Interest-Only ARM: With an interest-only ARM, you pay just the interest on the loan for a specified introductory period, then the principal payments kick in on top. The longer the introductory period, the higher your payments will be when the delayed principal payments enter the equation.
Hybrid ARM: As outlined above, a hybrid ARM begins with a fixed-rate introductory period followed by an adjustable-rate period. Typically, a hybrid ARM’s fixed-rate period lasts anywhere between three to 10 years, and its rates adjust at an agreed-upon frequency during the adjustable-rate period, such as once every six months or once a year.
Pros and Cons of an Adjustable-Rate Mortgage (ARM)
The low introductory rate allows you to save money and plan for when the adjustable-rate period kicks in.
If you plan to live in the home for a long time, a fixed-rate mortgage may be a better option.
If you plan on selling in a few years, you can use the proceeds to pay back your mortgage before the fixed-rate period ends.
Without knowing what will happen to interest rates, your monthly payments could become unaffordable.
If the index decreases over time, you could end up with a lower interest rate and monthly payments.
Financial planning is more difficult with an ARM, since there’s no telling what your monthly payments will be one year to the next.
Home Monthly Payment Calculator
To get an idea of how your mortgage payment will fit into your budget, use our free Home Monthly Payment Calculator by clicking the button below. With current rates based on national averages and customizable mortgage terms, you can experiment with different values to get an estimate of your monthly payment for any listing price.
For more information on financing your next home purchase, connect with an experienced, local Windermere agent.
Although there are certain fundamental principles to contemporary design, it is constantly evolving. While other interior design styles are often rooted in a specific period, contemporary design is set in the present. What’s popular now is what’s popular in contemporary design. Its ability to remain timeless is what gives contemporary design its greatest quality—it never goes out of style. Learn a bit more about contemporary design to find ways to incorporate it into your home.
What is contemporary interior design?
Contemporary style is characterized by clean lines, state-of-the-art materials, and a preference for openness over ornamentation. These tenets go hand in hand with the philosophies of modernism and minimalism, but contemporary design simply dips its toes in these other design styles without relying on them too heavily.
The aesthetic of modern construction lends itself well to contemporary design. Industrial spaces and open rooms with high ceilings and large windows help to deliver a magazine-quality contemporary look. But even if your home isn’t tailor-made for contemporary design, you can still curate it.
Image Source: Getty Images – Image Credit: vicnt
Contemporary Design in Your Home
The simplest way to incorporate contemporary design philosophy into your home is to let the natural architectural elements show. Let your exposed wooden beams and brick walls shine, decluttering the spaces around them to make them the focal point. This can make your spaces feel empty at first but remember; contemporary design is all about opening things up to effectively apply decorative details.
Choose modern furniture with clean lines and solid-colored fabrics. In the kitchen and bathroom, chrome and metallic surfaces will reinforce a contemporary aesthetic. When decorating, start with a neutral foundation (white, grey, and black) and add bold accent colors on top. The timeless appeal of a hardwood floor makes it a fitting choice for achieving contemporary style, while textured textiles in natural fabrics will help to liven up your spaces.
Stone, metal, and glass mix well in contemporary design, often combined in the selection of living room sets, decorative centerpieces, and kitchen/bathroom design. Large pieces of art, accent walls, and bold decorations help to broaden the color palette of contemporary spaces. You are free to choose bold, impactful hues from across the color spectrum in your decoration.
The Differences Between Contemporary and Modern Design
Whereas contemporary design is centered on what is popular during the present, modern design is rooted in a specific time period. Modern design dates back to at least the early twentieth century, which evolved into mid-century modern during the 1950s.
Modern design typically has earthier colors and a general preference for wood, whereas saturated colors and metals/glass are more at home in contemporary design. Choosing modern design means you’re choosing to make decorative variations on a theme, whereas the theme of contemporary design is always changing, so you never know where it might lead.
Visit our Design Styles page to learn more about common interior design styles and how you can incorporate them into your home:
This video is the latest in our Monday with Matthew series with Windermere Chief Economist Matthew Gardner. Each month, he analyzes the most up-to-date U.S. housing data to keep you well-informed about what’s going on in the real estate market.
Hello there, I’m Windermere’s Chief Economist Matthew Gardner and welcome to this month’s episode of Monday with Matthew. Today we are going to take a look at the new home market where headwinds are certainly growing. And the reason this particular subject piqued my interest was that the National Association of Home Builders just released their Housing Market Index for August, and the numbers were certainly eye-opening.
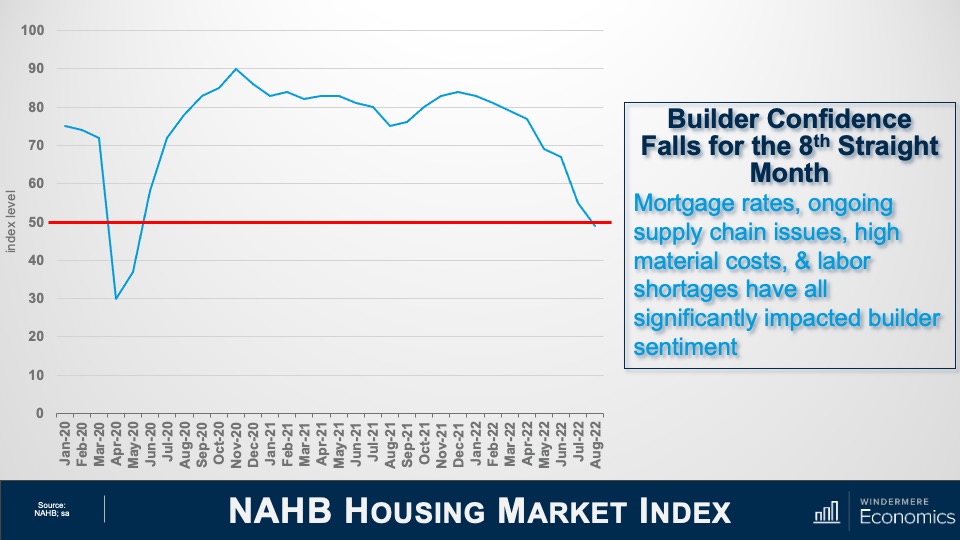
Now, for those of you who may not be particularly familiar with this index, it is based on a survey of home builders which asks them to give their opinions on the single-family home market and asks them to rate current market conditions for the sale of homes today as well as in six months’ time. It also asks their opinion regarding foot traffic of prospective buyers to their new home communities.
NAHB Housing Market Index
And as you can see, the headline index level fell six points to 49. The drop in August marked the eighth consecutive monthly decline for the Housing Market Index. It was also notable because it was the first time since May of 2020 that the index has dropped below the key 50 breakeven level. This is significant, as it tells us that today more home builders currently rate sales conditions as poor than good.
Now, while the August number was certainly lower than some economists had forecast, I was actually not too surprised as builders have been reporting a spike in cancelled contracts recently. In fact, a report I just read that was put out by John Burns Consulting suggested that the cancellations have more than doubled since April with 17.6% of buyers pulling out of their purchases in July. That compares to 8% in April and 7 ½% a year ago.
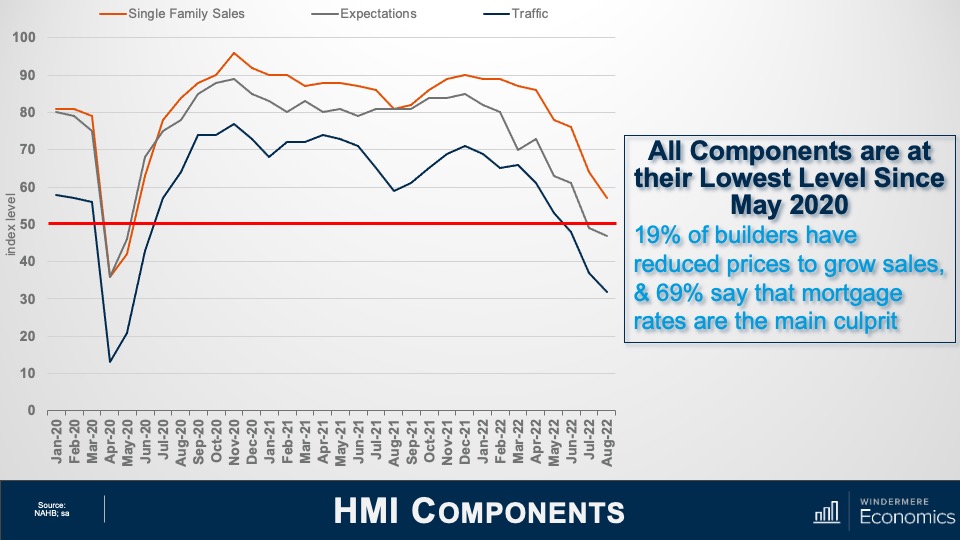
Housing Market Index Components
This chart shows a breakdown of three components of the Housing Market Index which are all at their lowest levels since May of 2020, which was just before housing activity rebounded following the lockdown due to COVID-19.
The present sales index fell seven points to 57 but is still above the breakeven point
The future sales series fell two points to 47
Prospective buyer traffic fell five points to 32 which, if we exclude the pandemic, represents the lowest index level since April of 2014
I find this index has a very strong correlation with new home sales, but I also use it as a pretty reliable leading indicator when it comes to single-family housing starts. I’ll get to that shortly. The survey also stated that one in five builders had reduced prices in August. That might help to explain the 10-point spread between builders’ perception of current versus future sales. But there are limits on home builders’ ability to keep cutting prices in order to support sales. This has become a significant issue because many of them are currently holding a large stock of inventory.
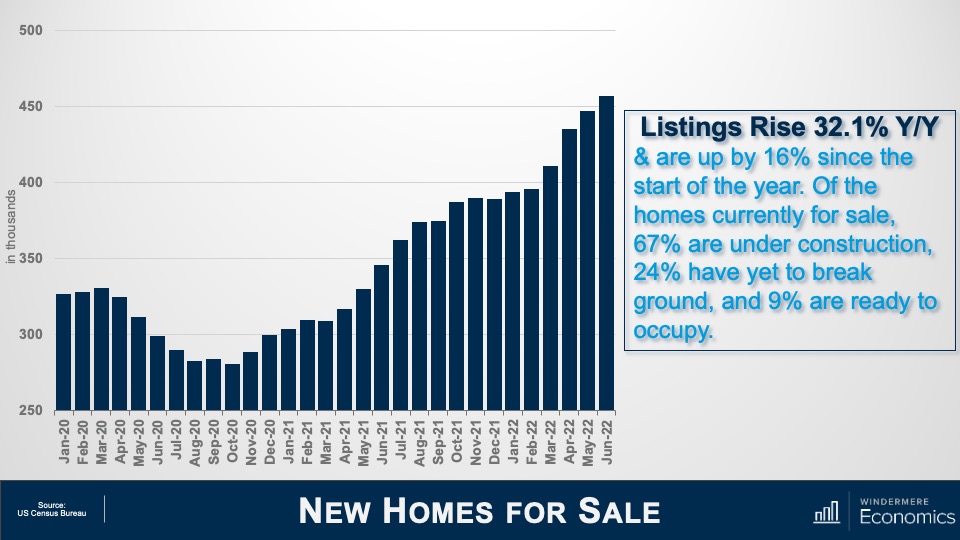
New Homes for Sale
Here is what current inventory levels look like. Although you might think that it’s not that bad given that only 9% of available homes are finished are ready to move into, I would tell you that builders incur costs every day that a home is not sold, even if that home has yet to be built. And with inventory at a level not seen since 2008, I’m sure there are a lot of builders not sleeping too well right now.
I would add that by the time the above video is released, the July new home sales report will have been published. I can almost guarantee that the number of homes for sale will have grown further.
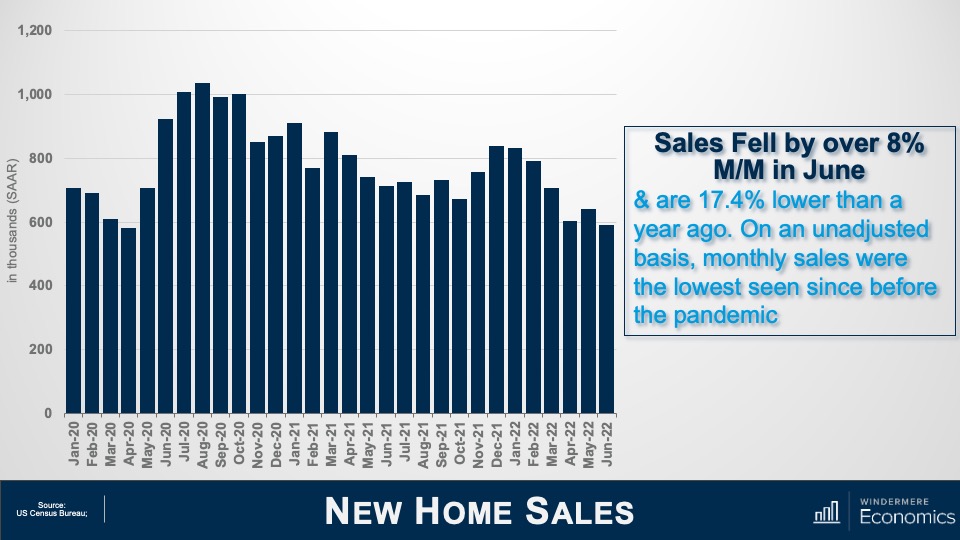
New Homes Sales
Higher inventory levels are due to slower sales activity, which is continuing to decline. Sales are 17% lower than a year ago. With more homes for sale and lower transactions, it would now take more than nine months to absorb all available homes using the current sales pace. I would also tell you that the last time months of supply broke above nine was all the way back in 2010.
It’s my forecast that sales in July will have dropped from the annualized rate of 590,000 shown in the chart above to somewhere between 570,000 and 580,000.
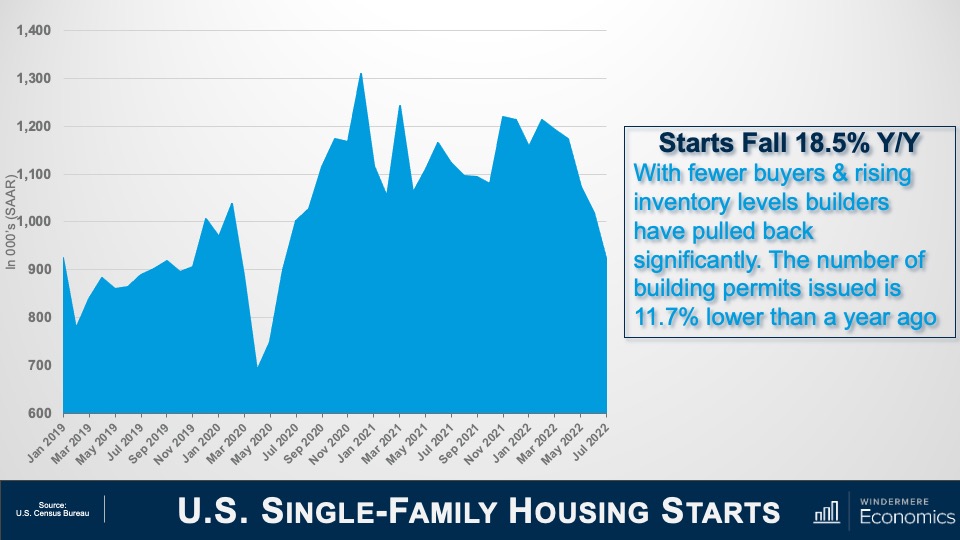
U.S. Single-Family Housing Starts
With high supply levels and lower sales, it’s not at all surprising to see builders hitting the brakes, with new home starts falling by 10.1% between June and July of this year. Starts are down by 18 ½% from a year ago. Starts have dropped on a sequential basis for five consecutive months now, and I am afraid that they will drop further before finding a bottom.
So, what’s the bottom line here? Well, there are several issues I see, the first of which is affordability. Home prices have been spiraling upward since the start of the pandemic not only because mortgage rates dropped, but construction costs started jumping and builders had to charge more for a home.
Builders saw prices rise by almost 18% last year. This had already taken a significant toll on affordability even before the mortgage rates spike we saw earlier this year. The upshot, as I see it, is that tighter monetary policy from the Fed, in concert with construction costs that remain well above normal levels, has hit builders and hit them hard. Of course, they are doing their best to address the situation by slowing construction activity significantly, but I think that they are going to have a pretty rough time for the next several months.
Ultimately, I see little option for home builders other than lowering prices further, especially now that they are competing with rising inventories in the resale market. I also believe that there are buyers out there waiting patiently on the sidelines for prices to drop in the coming months as they know that builders at some point have to solve the current supply demand imbalance and lowering prices is the easiest way of doing this. Last month the average price drop was 5%, but this is very likely to increase as we move toward the fall.
Will builders get through the situation they find themselves in? I believe that they will. And there are some glimmers of light out there with inflation appearing to be peaking, interest rates are, if not dropping, then certainly stabilizing, and this will help.
Builders also understand that the country has a significant housing shortage. In fact, a recent report published by “Up For Growth” suggested that we have a housing shortage today of around 3.8 million homes. Although this includes rental and ownership housing, some basic math tells me that there is a need today for around 2.5 million new owner-occupied homes. So, light is definitely at the end of the tunnel, but there is a way to go before they get out of it.
And there you have it. I hope that you’ve found my thoughts on this topic of interest. As always, if you have any questions or comments about the current new home environment, please do reach out to me. In the meantime, stay safe out there and I look forward to visiting with you all again next month.
Bye now.
About Matthew Gardner
As Chief Economist for Windermere Real Estate, Matthew Gardner is responsible for analyzing and interpreting economic data and its impact on the real estate market on both a local and national level. Matthew has over 30 years of professional experience both in the U.S. and U.K.
In addition to his day-to-day responsibilities, Matthew sits on the Washington State Governors Council of Economic Advisors; chairs the Board of Trustees at the Washington Center for Real Estate Research at the University of Washington; and is an Advisory Board Member at the Runstad Center for Real Estate Studies at the University of Washington where he also lectures in real estate economics.
Once you and your agent work through the process of selling your home, there comes a point when it’s time to switch gears and get ready to move. It can be difficult to juggle the various steps of the moving process, especially if you’re Buying and Selling a Home at the Same Time. Using a moving checklist will help you stay organized and on schedule throughout your moving timeline.
Moving Checklist: A Step-by-Step Guide to the Moving Process
We’ve included a comprehensive checklist below of all the steps you’ll need to complete to ensure a smooth, successful move. This list is also available as an interactive web page and downloadable PDF here: Moving Checklist
Twelve Weeks Before:
Get estimates from professional movers or truck rental companies if needed.
Once you’ve selected a mover, discuss insurance, packing, loading and delivery, and the claims procedure.
Six to Eight Weeks Before:
Use up things that may be difficult to move, such as frozen food.
Sort through your possessions. Decide what you want to keep, what you want to sell, and what you wish to donate to charity.
Record serial numbers on electronic equipment, take photos (or video) of all your belongings and create an inventory list.
If you are moving yourself, use your inventory list to determine how many boxes you will need. Stock up on the items you’ll need from our “Moving Essentials” list.
Obtain a change of address packet from the post office and send it to creditors, magazine subscription offices, and catalog vendors.
Discuss tax-deductible moving expenses with your accountant and begin keeping accurate records.
If you’re moving to a new community, contact the Chamber of Commerce and school district and request information about services.
Make reservations with airlines, hotels, and car rental agencies, if needed.
Begin packing nonessential items.
Two to Four Weeks Before:
Arrange for storage, if needed.
If you have items you don’t want to pack and move, hold a yard sale.
Update the address listed on your car registration, license, and insurance.
Transfer your bank accounts and safe-deposit box items to new branch locations if needed. Cancel or redirect any direct deposit or automatic payments from your accounts.
Make special arrangements to move your pets and consult your veterinarian about ways to make travel comfortable for them.
Have your car checked and serviced if you’ll need to drive it a long distance.
Change your utilities, including phone, power, and water, from your old address to your new address.
Week of Moving Day:
Defrost your refrigerator and freezer.
Have movers pack your belongings.
Label each box with the contents and the room where you want it to be delivered.
If you’re using a moving company, arrange to pay for their services in full, or the remainder of what you owe, upon delivery.
Set aside legal documents and valuables that you do not want packed.
Pack clothing and toiletries, along with extra clothes in case the moving company is delayed.
Give your travel itinerary to a close friend or relative so they can reach you as needed.
Pack a first-day box with items that you’ll want accessible before other boxes are unpacked. See our list of suggested items on the right and add any others you’ll want to include.
Moving Day:
Old Home
Pick up the truck as early as possible if you are moving yourself.
Make a list of every item and box loaded on the truck.
Let the mover know how to reach you.
Double-check your closets, cupboards, attic, basement, yard, and garage for any left-behind items.
New Home
Be on hand at the new home to answer questions and give instructions to the mover.
Check off boxes and items as they come off the truck.
Confirm that the utilities have been turned on and are ready for use.
Unpack your first-day box.
Unpack your children’s toys and find a safe place for them to play.
Examine your goods for damage.
Our Moving Checklist page has all the information above, plus helpful lists for Moving Essentials and which items to pack in your First-Day Box available as a downloadable PDF.
For additional information on the selling process from start to finish, tips on working with an agent, and more, visit our Home Selling Guide:
Becoming a homeowner comes with many responsibilities, but if the home you’re purchasing requires you to be part of a Homeowners Association (HOA), you’ll have to follow additional guidelines and pay additional fees. As you’re looking for homes, talk to your agent about whether purchasing a home that’s part of an HOA is right for you.
What is a Homeowners Association (HOA)?
A Homeowners Association is an organization that governs a community of homes. Homeowners within the governed community must follow certain guidelines for property upkeep and maintenance and will face restrictions on their ability to make additions and/or changes to the property. These rules exist to maintain a standard level of quality amongst the community to maximize property value.
Different HOAs may have different stipulations based on the type of housing they govern. For example, an HOA may oversee a community of detached single-family homes, but they are commonly found in communities of condo or townhome housing styles where there is a shared, communal living style. Each HOA has a Board of Directors in charge of enforcing rules, collecting fees, and managing the funds, and certain associations may hire a third-party management company to help the Board of Directors carry out their operations. The members of an HOA are the residents who live in that community. Here are some examples of typical HOA property restrictions:
Exterior paint color choices must be submitted for approval
Grass must be mowed regularly
Flower beds must be kept weed-free
Noise regulations and/or noise curfew
Pet restrictions (type of animal and/or number of pets per household)
Homeowners Association (HOA) Pros and Cons
Living in an HOA community means your property will maintain its curb appeal and you can live with the knowledge that systems are in place to protect property values. However, the benefits come with additional restrictions on your freedoms as a homeowner while increasing your monthly payments.
If you buy in a development governed by a Homeowners Association, you will be required to pay HOA fees on top of your monthly mortgage payment. Typically paid monthly, HOA fees go toward the neighborhood’s shared spaces, property maintenance, and amenities. Homeowners Association fees vary greatly depending on the particulars of that community’s agreement. These fees often cover landscaping costs, parking, community security, garbage pickup, maintenance and repair, insurance, and other amenities, such as a shared pool or gym. If the home is your primary residence, your HOA fees are not tax-deductible.
HOA fees are an additional expense you’ll have to budget for when buying a home. To get an idea of what you can afford, use our free Home Monthly Payment Calculator by clicking the button below. With current rates based on national averages and customizable mortgage terms, you can experiment with different values to get an estimate of your monthly payment for any listing price, accounting for any HOA fees you may incur.
The following analysis of select counties of the Western Washington real estate market is provided by Windermere Real Estate Chief Economist Matthew Gardner. We hope that this information may assist you with making better-informed real estate decisions. For further information about the housing market in your area, please don’t hesitate to contact your Windermere Real Estate agent.
Regional Economic Overview
The most recent employment data (from May) showed that all but 2,800 of the jobs lost during the pandemic have been recovered. More than eight of the counties contained in this report show employment levels higher than they were before COVID-19 hit. The regional unemployment rate fell to 4.5% from 5.2% in March, with total unemployment back to pre-pandemic levels. For the time being, the local economy appears to be in pretty good shape. Though some are suggesting we are about to enter a recession, I am not seeing it in the numbers given rising employment and solid income growth.
Western Washington Home Sales
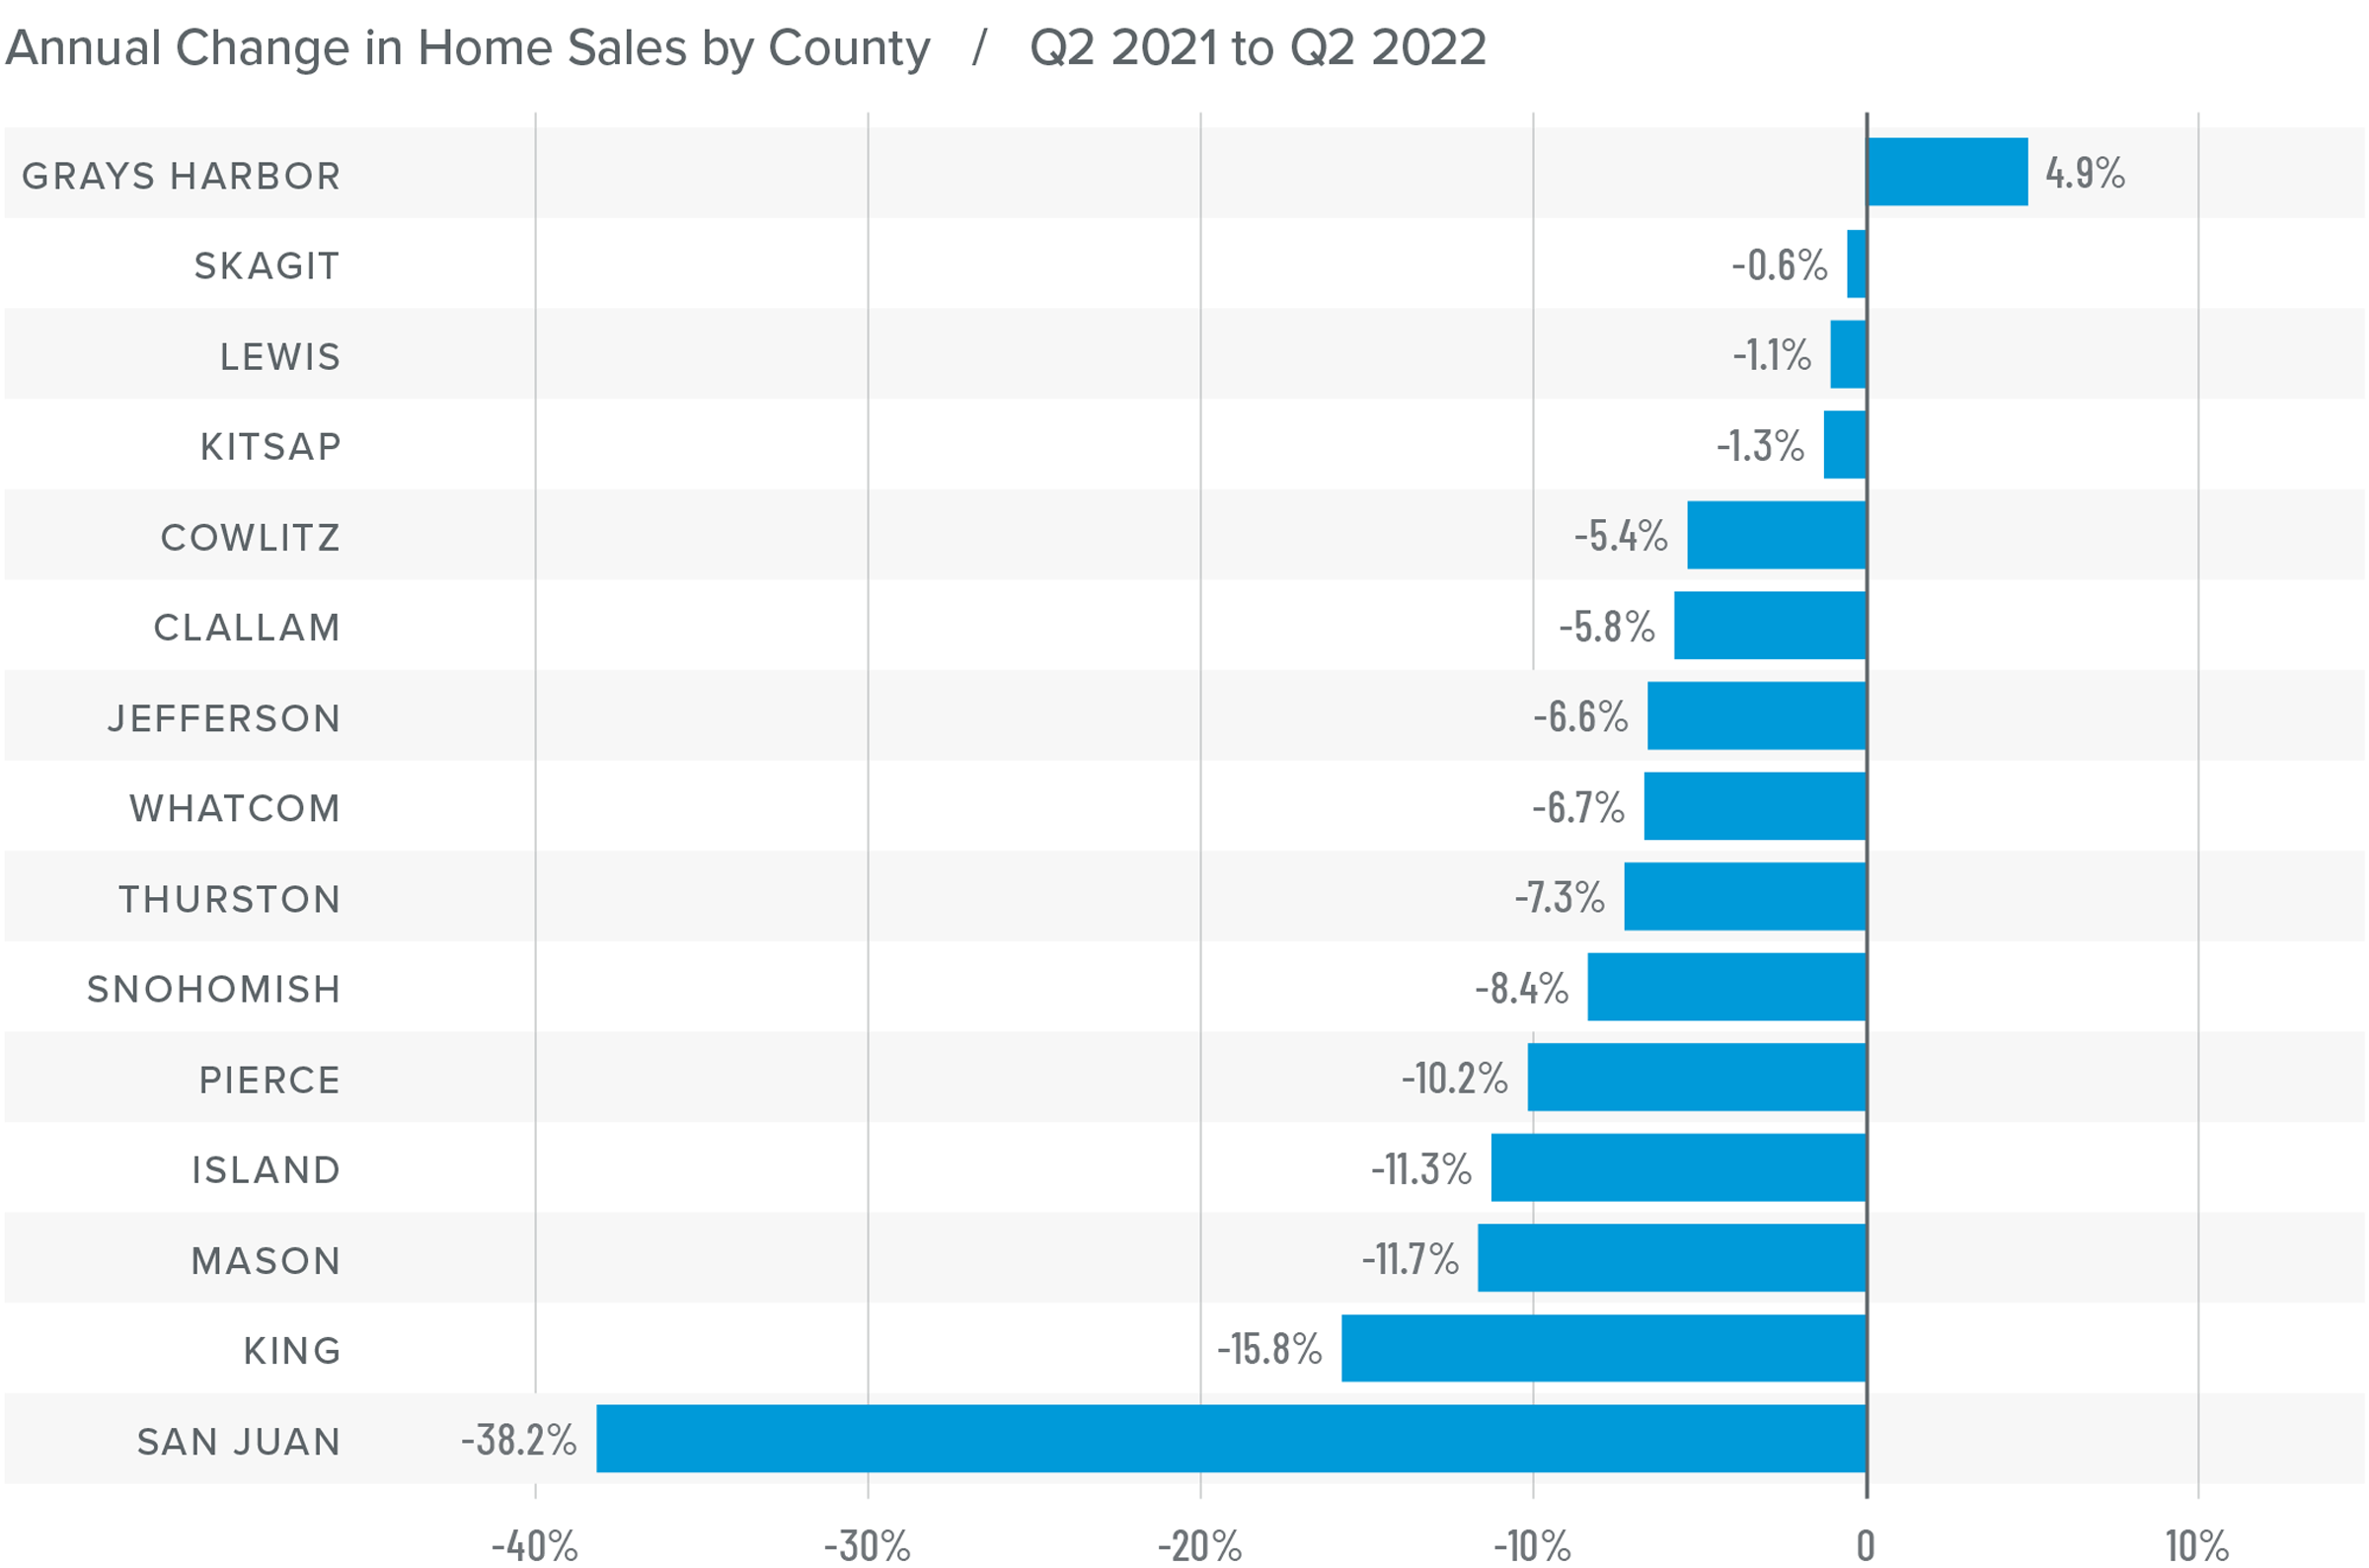
❱ In the second quarter of 2022, 23,005 homes sold, representing a drop of 11% from the same period a year ago, but up by a significant 52% from the first quarter of this year.
❱ Sales rose in Grays Harbor County compared to a year ago but fell across the balance of the region. The spring market, however, was very robust, likely due to growing inventory levels and buyers trying to get ahead of rising mortgage rates.
❱ Second quarter growth in listing activity was palpable: 175% more homes were listed than during the first quarter and 61.98% more than a year ago.
❱ Pending sales outpaced listings by a factor of 3:1. This is down from the prior year but only because of the additional supply that came to market.
Western Washington Home Prices
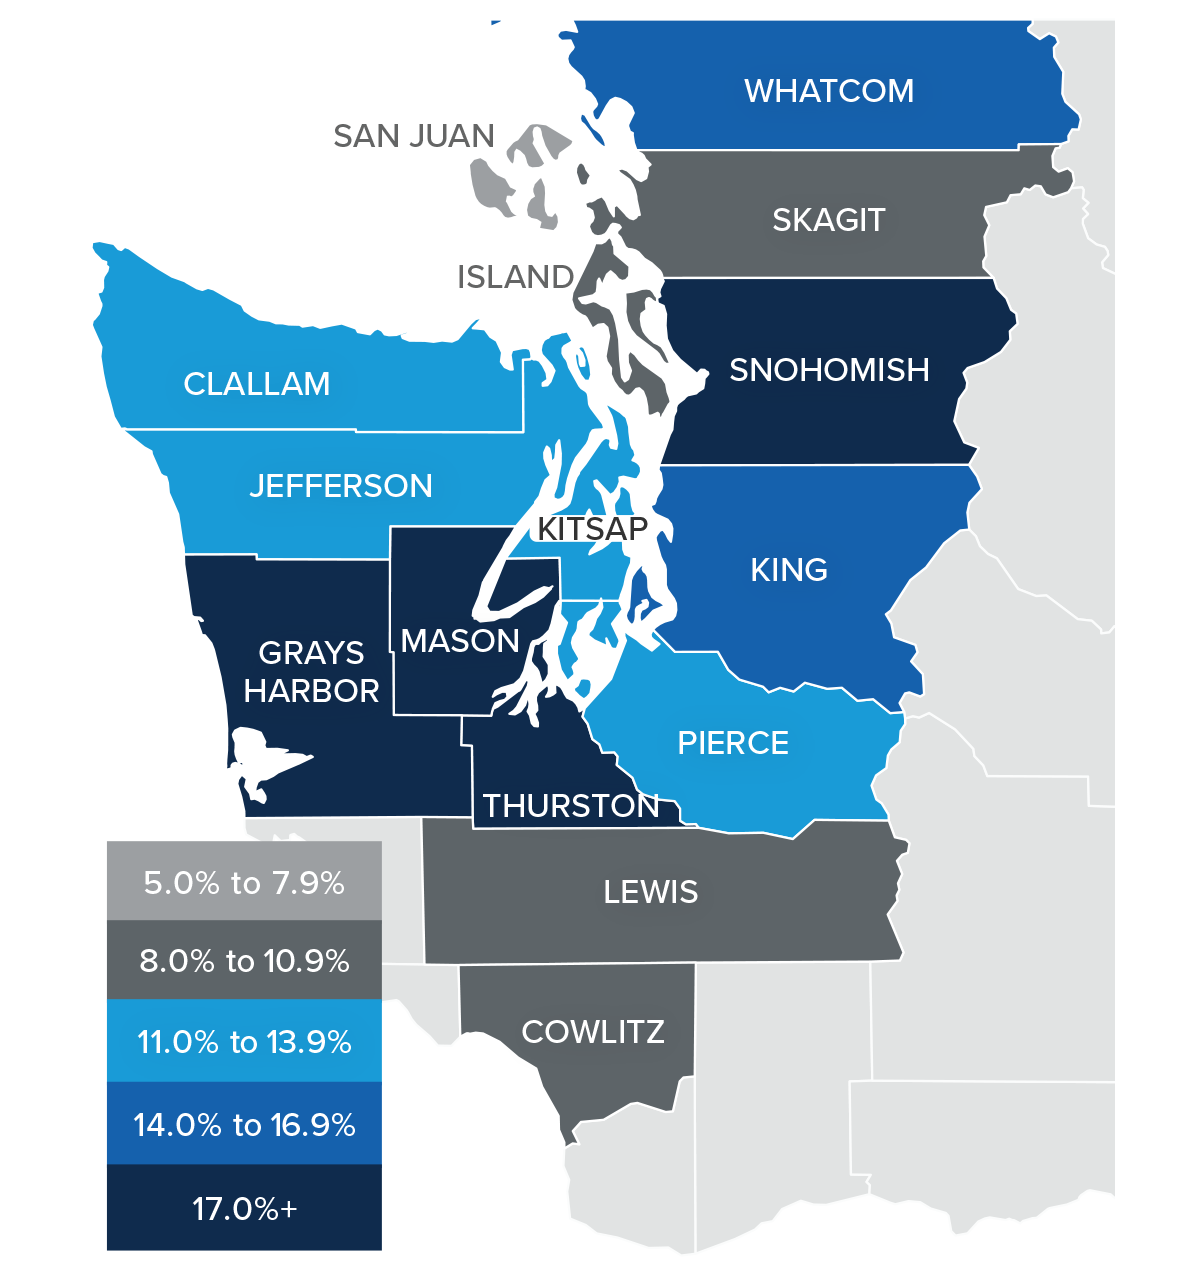
❱ Even in the face of rising mortgage rates, home prices continue to rise at a well-above-average pace, with average prices up 13.3% year over year to $830,941.
❱ I have been watching list prices as they are a leading indicator of the health of the housing market. Thus far, despite rising mortgage rates and inventory levels, sellers remain confident. This is reflected in rising median list prices in all but three counties compared to the previous quarter. They were lower in San Juan, Island, and Jefferson counties.
❱ Prices rose by double digits in all but four counties. Snohomish, Grays Harbor, Mason, and Thurston counties saw significant growth.
❱ List prices and supply are both trending higher, but this has yet to slow price growth significantly. I believe we will see the pace of appreciation start to slow, but not yet.
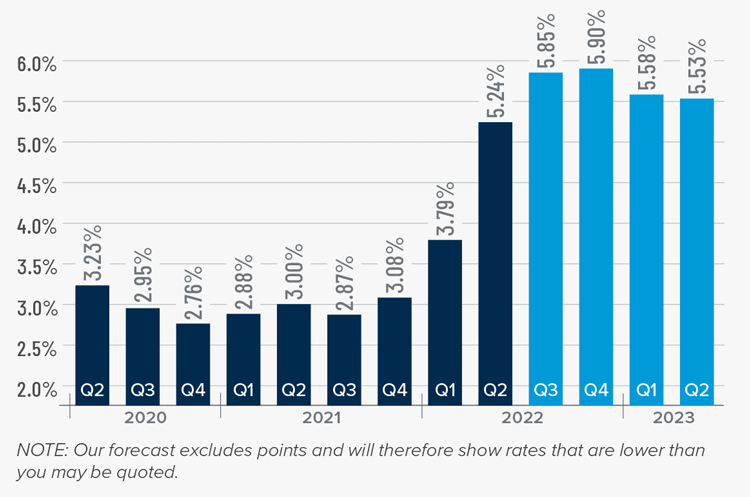
Mortgage Rates
Although mortgage rates did drop in June, the quarterly trend was still moving higher. Inflation—the bane of bonds and, therefore, mortgage rates—has yet to slow, which is putting upward pressure on financing costs.
That said, there are some signs that inflation is starting to soften and if this starts to show in upcoming Consumer Price Index numbers then rates will likely find a ceiling. I am hopeful this will be the case at some point in the third quarter, which is reflected in my forecast.
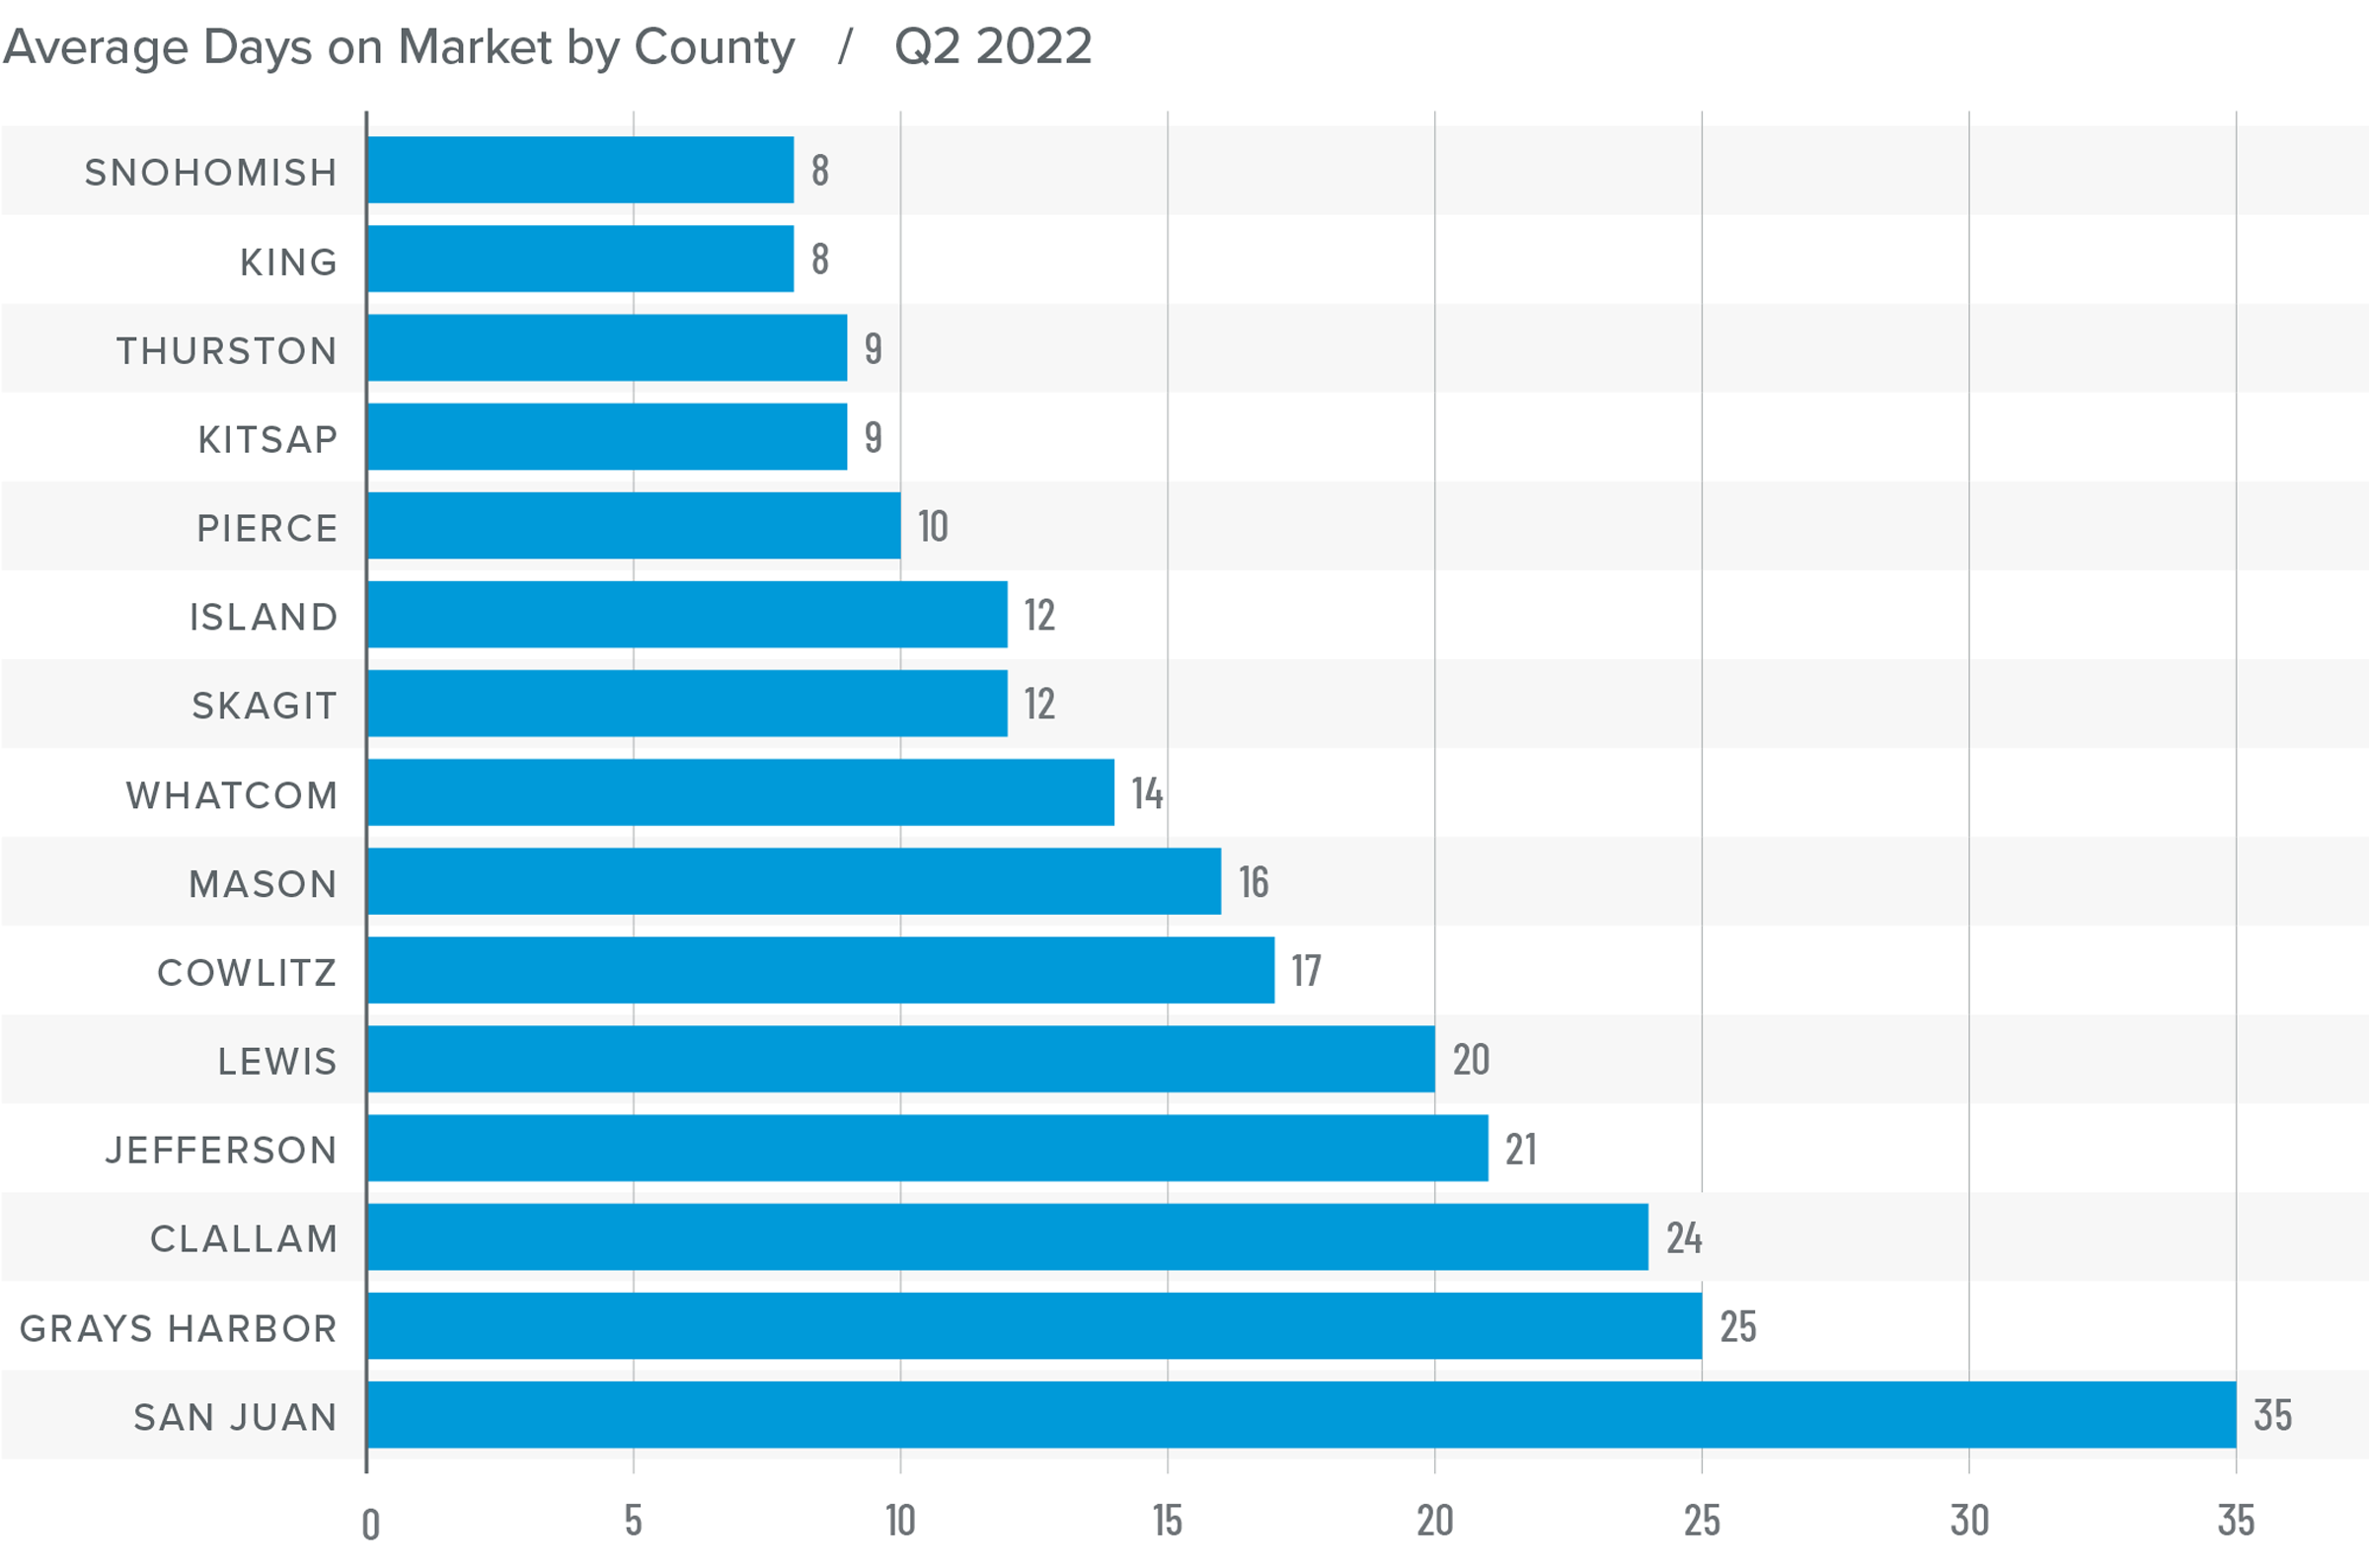
Western Washington Days on Market
❱ It took an average of 16 days for a home to go pending in the second quarter of the year. This was 2 fewer days than in the same quarter of 2021, and 9 fewer days than in the first quarter.
❱ Snohomish, King, and Pierce counties were, again, the tightest markets in Western Washington, with homes taking an average of between 8 and 10 days to sell. Compared to a year ago, average market time dropped the most in San Juan County, where it took 26 fewer days for a seller to find a buyer.
❱ All but six counties saw average time on market drop from the same period a year ago. The markets where it took longer to sell a home saw the length of time increase only marginally.
❱ Compared to the first quarter of this year, average market time fell across the board. Demand remains very strong.
Conclusions
This speedometer reflects the state of the region’s real estate market using housing inventory, price gains, home sales, interest rates, and larger economic factors.
The economy remains buoyant, which is an important factor when it comes to the regional housing market, particularly as it affects buyers. Even though the number of homes that came to market has jumped significantly, which should favor those looking for a new home, demand is still robust, and the market remains competitive.
Much to the disappointment of buyers, rising listing prices suggest that sellers are clearly still confident even as financing costs continue to increase. While the pace of price growth is slowing, sellers are still generally in control. As such, I have moved the needle a little more in the direction of sellers. Until we see list-price growth and home sales slow significantly, we will not reach a balanced market.
About Matthew Gardner
As Chief Economist for Windermere Real Estate, Matthew Gardner is responsible for analyzing and interpreting economic data and its impact on the real estate market on both a local and national level. Matthew has over 30 years of professional experience both in the U.S. and U.K.
In addition to his day-to-day responsibilities, Matthew sits on the Washington State Governors Council of Economic Advisors; chairs the Board of Trustees at the Washington Center for Real Estate Research at the University of Washington; and is an Advisory Board Member at the Runstad Center for Real Estate Studies at the University of Washington where he also lectures in real estate economics.
The “demise of downtown” has been greatly exaggerated, according to Windermere’s Chief Economist, Matthew Gardner. That’s one assessment Gardner made recently, along with other observations about the current housing and job markets in the Seattle area.
According to Gardner, those who keep tabs on the real estate market should be careful about reading too much into year-over-year price changes in the housing market. While King County is up 23.5% and Snohomish County is up by almost 33%, Gardner reminds us that the housing market was in a very different place a year ago than it is today. The early days of pandemic shutdowns basically put last spring’s real estate market on hold. So while this year’s price increases certainly indicate a level of economic recovery has taken place, the data needs to be viewed in context for it to be truly useful.
Overall, Gardner advises a cautious optimism regarding the regional economy. He observes that things are improving, but he says it’s important not to get carried away. While Gardner predicts a period of aggressive growth for the next year, he reminds us that many people were spending their money very cautiously this time last year, so naturally as the economy opens back up there will be built-in growth ahead.
On the subject of inflation, many economists caution about rates akin to those of the 1970s and 80s. Gardner, however, predicts a more moderate outcome. Although he thinks it’s likely we’ll have higher interest rates than we’ve seen in the last 30 years, he doesn’t believe we’ll see the same growth in the inflation rate. Gardner predicts that by 2022 things are likely to have settled down into a more typical pattern.
Finally, Gardner addresses the current levels of job loss caused by the pandemic. In total, the Puget Sound region lost about 216,000 jobs during the initial stages of the pandemic, but has since recovered about 103,000 of these. However, that recovery is not evenly distributed across industries. According to Gardner, construction has seen a full recovery of its jobs, and tech and information jobs were minimally impacted by the pandemic. On the other hand, the leisure and hospitality sectors have experienced much slower recovery, having lost about 79,000 jobs but adding back only about 29,000 of those.
As the leisure and hospitality sectors slowly recover from the pandemic, Gardner points out that there is another sign that the local economy is heading in the right direction: the growing demand for in-person entertainment and events. Though many large-scale events like conventions and concerts are still being planned out years in advance, the enthusiastic demand for these events and the easing of government restrictions preventing them is reason for optimism indeed.
The following analysis of the Western Washington real estate market is provided by Windermere Real Estate Chief Economist Matthew Gardner. We hope that this information may assist you with making better-informed real estate decisions. For further information about the housing market in your area, please don’t hesitate to contact me!
REGIONAL ECONOMIC OVERVIEW
In the summer and fall of 2020, Western Washington regained some of the jobs lost due to COVID-19, but employment levels in the region have been in a holding pattern ever since. As of February, the region had recovered 132,000 of the 297,000 jobs that were lost, but that still leaves the area down by 165,000 positions. Given the announcement that several counties may have to roll back to phase 2 of reopening, I would not be surprised to see businesses hold off on plans to add to their payrolls until the picture becomes clearer. Even with this “pause” in the job recovery, the region’s unemployment rate ticked down to 6.1% from the December rate of 6.4% (re-benchmarking in 2020 showed the December rate was higher than the originally reported 5.5%). The lowest rate was in King County (5.3%) and the highest rate was in Grays Harbor County, which registered at 9.2%. Despite the adjustment to the 2020 numbers, my forecast still calls for employment levels to increase as we move through the year, though the recovery will be slower in areas where COVID-19 infection rates remain elevated.
WESTERN WASHINGTON HOME SALES
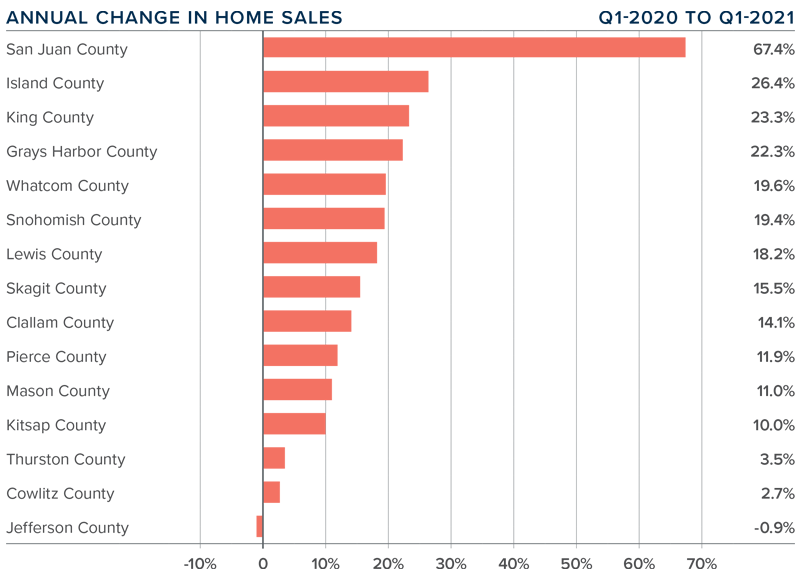
❱ Sales in the first quarter were impressive, with 15,893 home sales. This is an increase of 17.5% from the same period in 2020, but 32% lower than in the final quarter of last year—a function of low levels of inventory.
❱ Listing activity continues to be well below normal levels, with total available inventory 40.7% lower than a year ago, and 35.5% lower than in the fourth quarter of 2020.
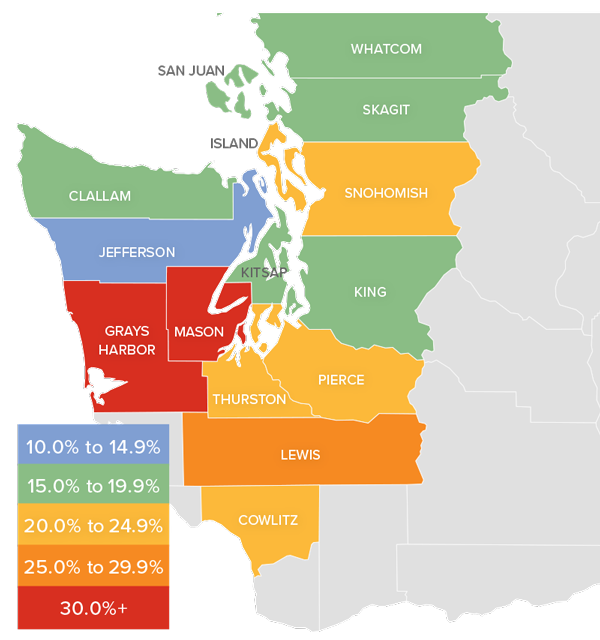
❱ Sales rose in all counties other than Jefferson, though the drop there was only one unit. There were significant increases in almost every other county, but sales growth was more muted in Cowlitz and Thurston counties. San Juan County again led the way, likely due to ongoing interest from second-home buyers.
❱ The ratio of pending sales (demand) to active listings (supply) shows how competitive the market is. Western Washington is showing pendings outpacing new listings by a factor of almost six to one. The housing market is as tight now as I have ever seen it.
WESTERN WASHINGTON HOME PRICES
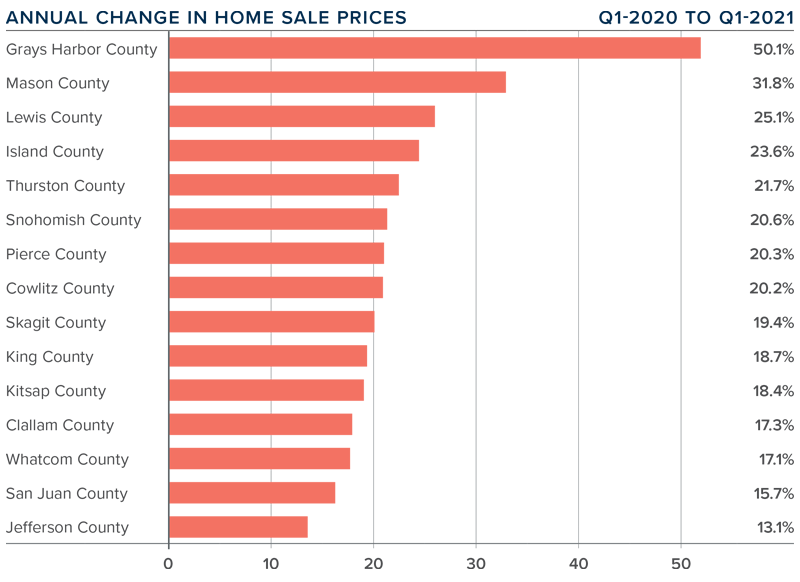
❱ Home price growth in Western Washington continues to trend well above the long-term average, with prices 21.3% higher than a year ago. The average home sale price was $635,079.
❱ Compared to the same period a year ago, price growth was strongest in Grays Harbor and Mason counties, but all markets saw double-digit price growth compared to a year ago.
❱ Home prices were also 2.9% higher than in the final quarter of 2020, which was good to see given that 30-year mortgage rates rose .4% in the quarter.
❱ I expect to see mortgage rates continue to trend higher as we move through the year, but they will remain significantly lower than the long-term average. Any increase in rates can act as a headwind to home-price growth, but excessive demand will likely cause prices to continue to rise.
DAYS ON MARKET
❱ The market in early 2021 continued to show far more demand than supply, which pushed the average time it took to sell a home down 25 days compared to a year ago. It took 2 fewer days to sell a home than it did in the final quarter of 2020.
❱ Snohomish and Thurston counties were the tightest markets in Western Washington, with homes taking an average of only 15 days to sell. The greatest drop in market time was in San Juan County, where it took 52 fewer days to sell a home than it did a year ago.
❱ Across the region, it took an average of only 29 days to sell a home in the quarter. All counties saw market time decrease from the first quarter of 2020.
❱ Very significant demand, in concert with woefully low levels of supply, continues to make the region’s housing market very competitive. This will continue to be a frustration for buyers.
CONCLUSIONS
This speedometer reflects the state of the region’s real estate market using housing inventory, price gains, home sales, interest rates, and larger economic factors.
Demand is very strong and, even in the face of rising mortgage rates, buyers are still out in force. With supply still lagging significantly, it staunchly remains a seller’s market. As such, I am moving the needle even further in their favor.
As I mentioned in last quarter’s Gardner Report, 2021 will likely see more homeowners make the choice to sell and move if they’re allowed to continue working remotely. On the one hand, this is good for buyers because it means more listings to choose from. However, if those sellers move away from the more expensive core markets into areas where housing is cheaper, it could lead to increased competition and affordability issues for the local buyers in those markets.
ABOUT MATTHEW GARDNER
As Chief Economist for Windermere Real Estate, Matthew Gardner is responsible for analyzing and interpreting economic data and its impact on the real estate market on both a local and national level. Matthew has over 30 years of professional experience both in the U.S. and U.K.
In addition to his day-to-day responsibilities, Matthew sits on the Washington State Governors Council of Economic Advisors; chairs the Board of Trustees at the Washington Center for Real Estate Research at the University of Washington; and is an Advisory Board Member at the Runstad Center for Real Estate Studies at the University of Washington where he also lectures in real estate economics.
Despite a bump in new listings the supply of homes still can’t keep up with the demand. The result? Multiple offers, escalation clauses, and record-breaking prices. If you’re considering selling your home, you’d be hard pressed to find a more lucrative market than what we have today.
March marked the first post-COVID/pre-COVID comparison, and the results were dramatic.
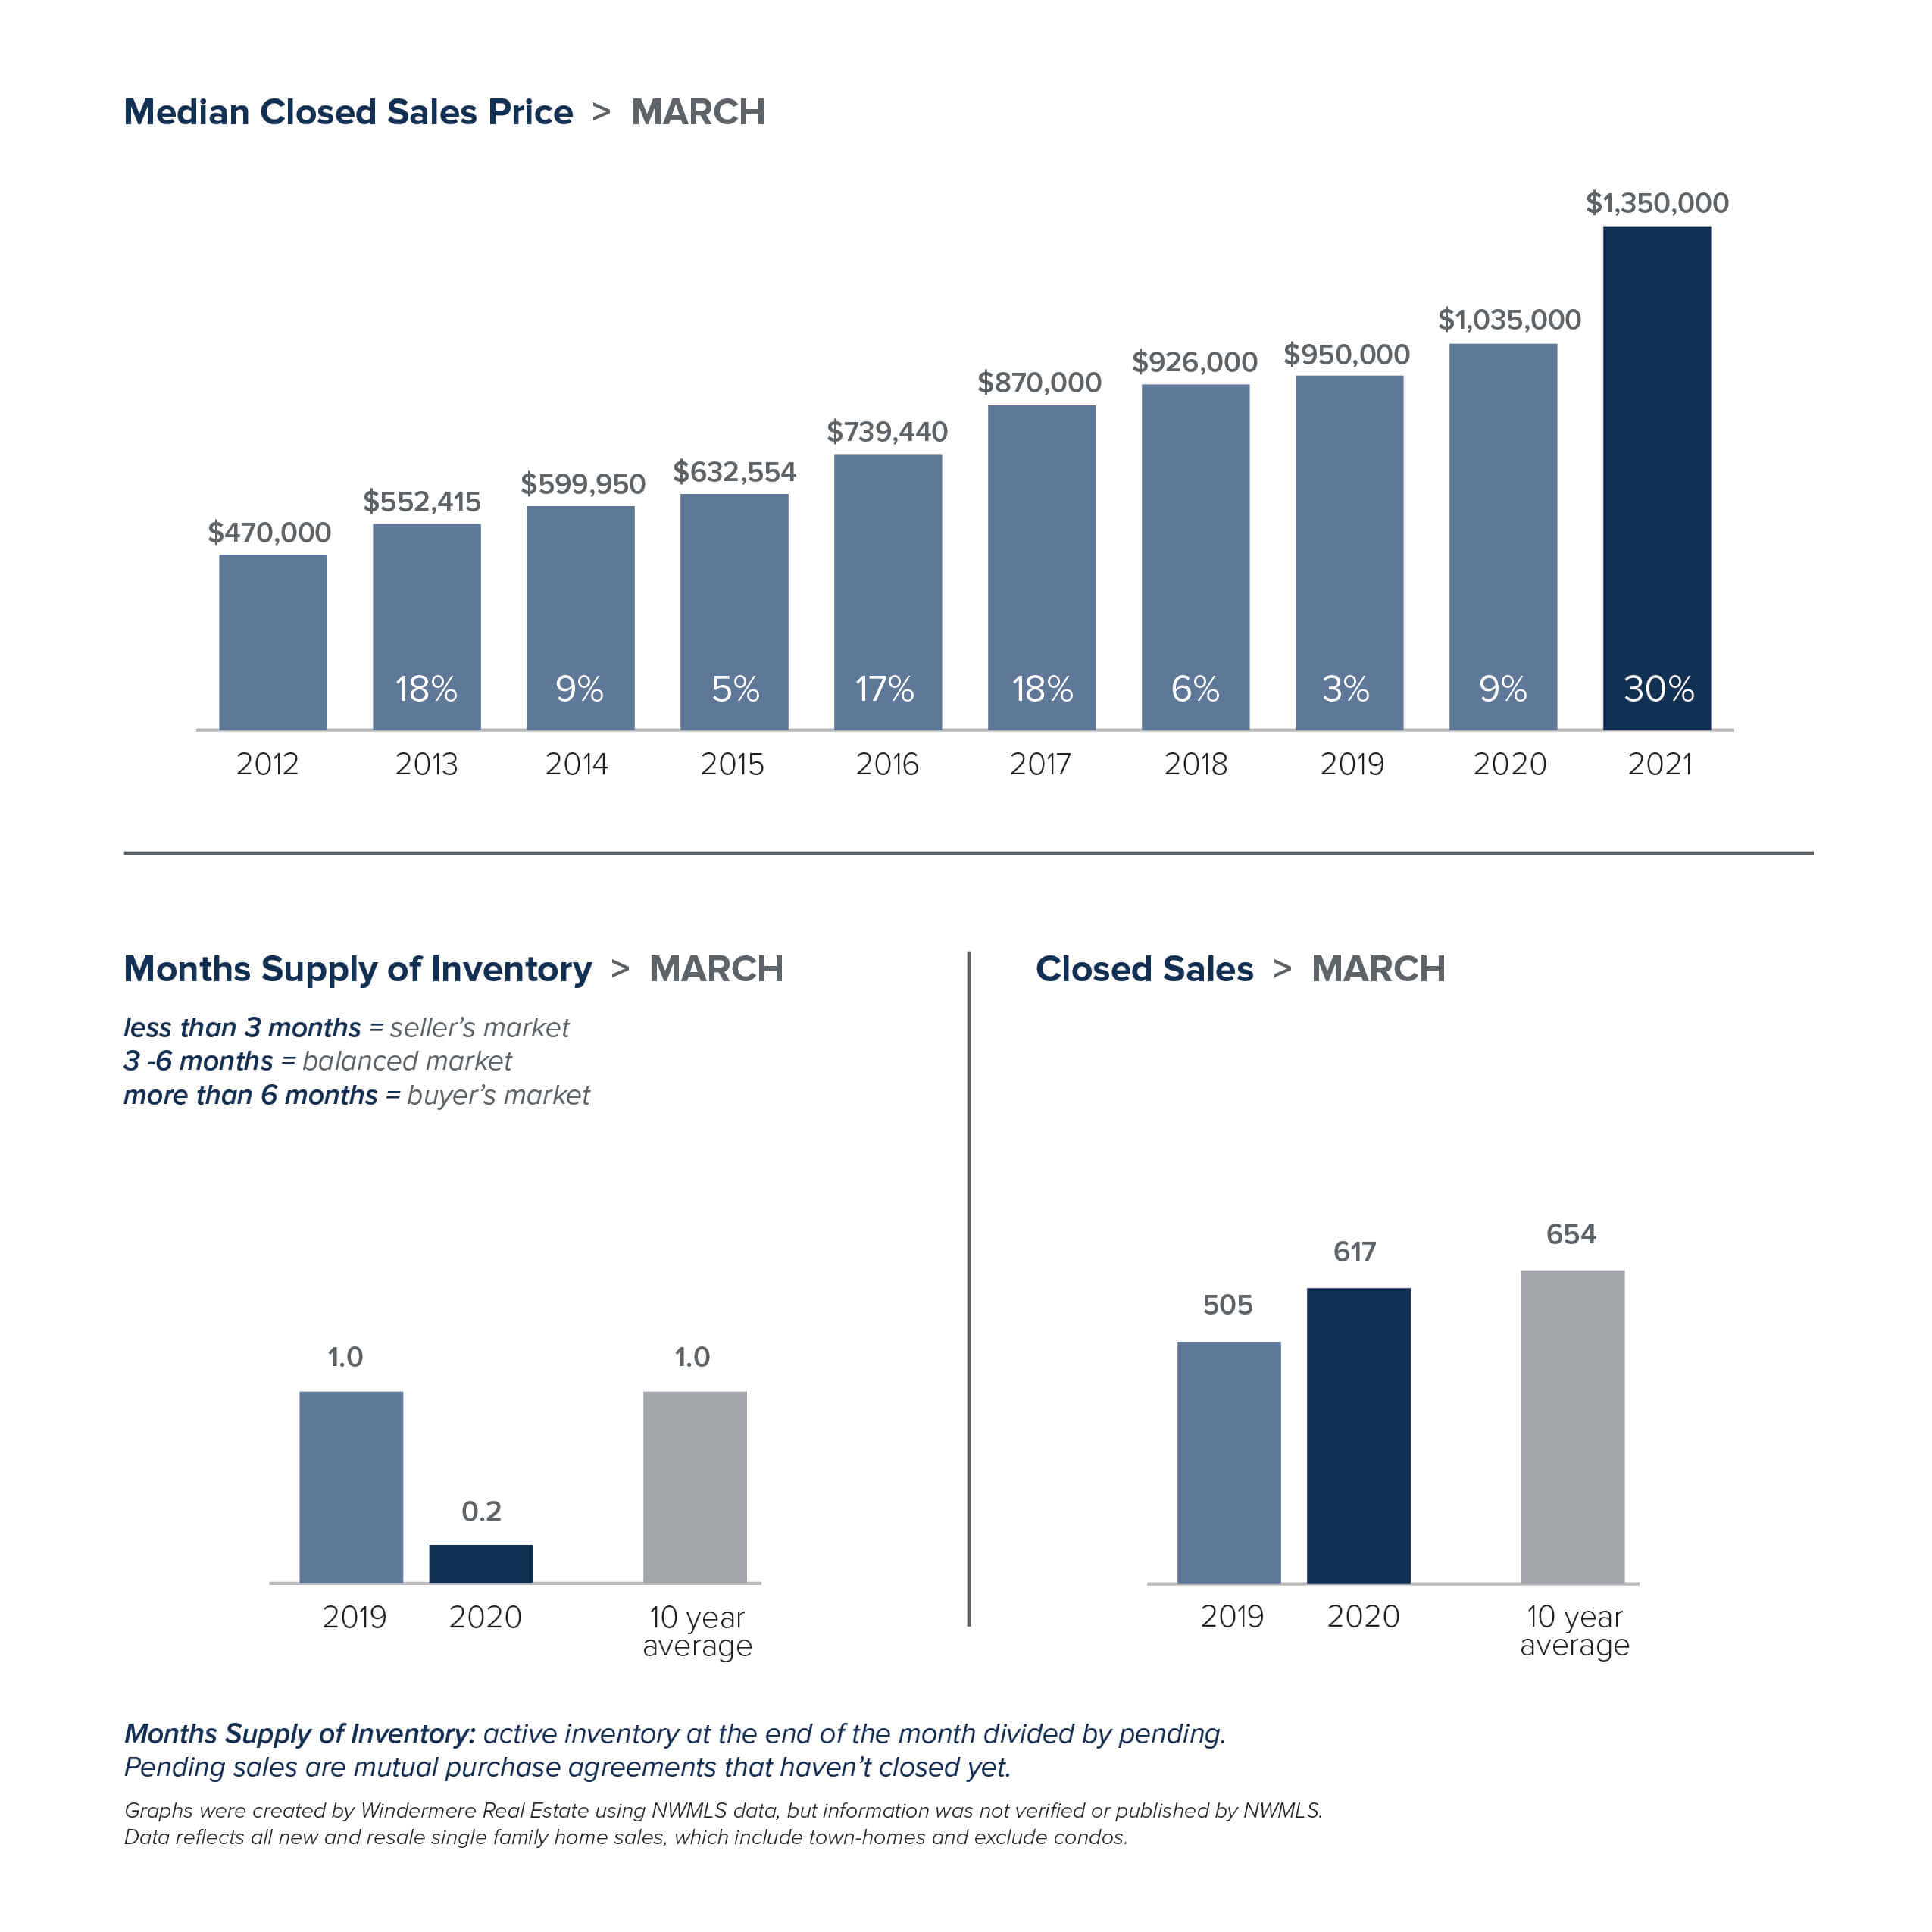
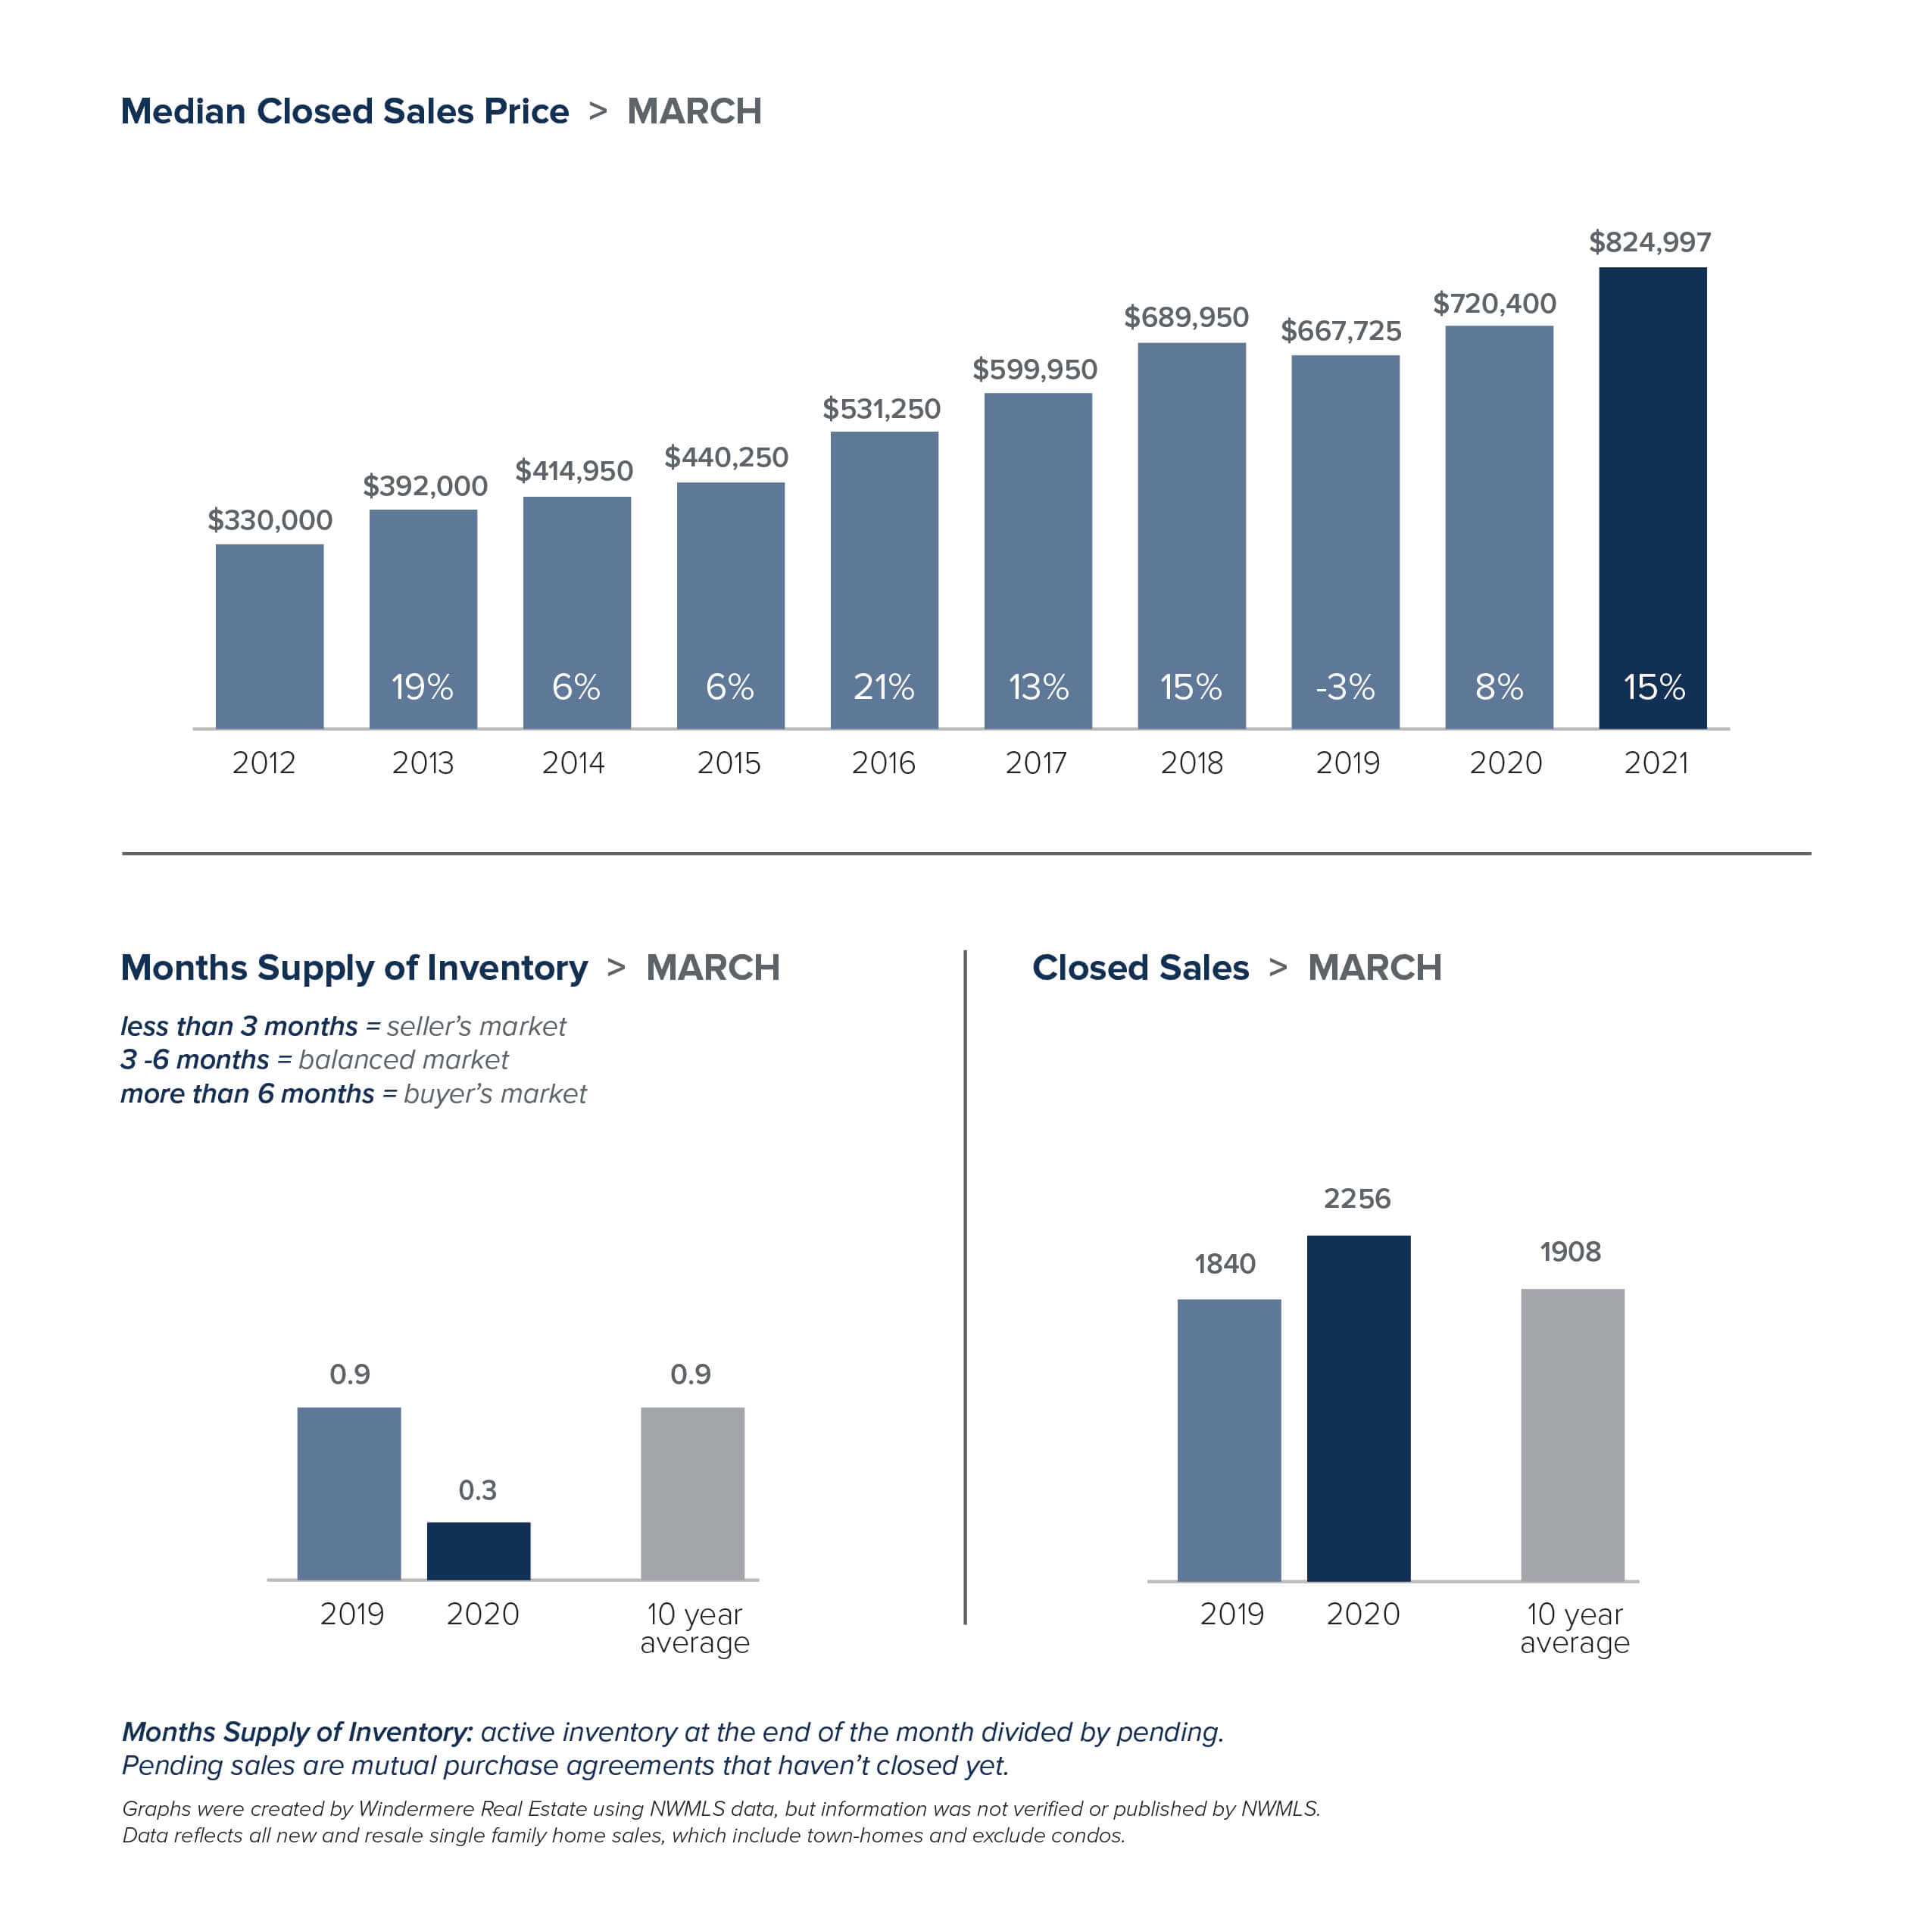
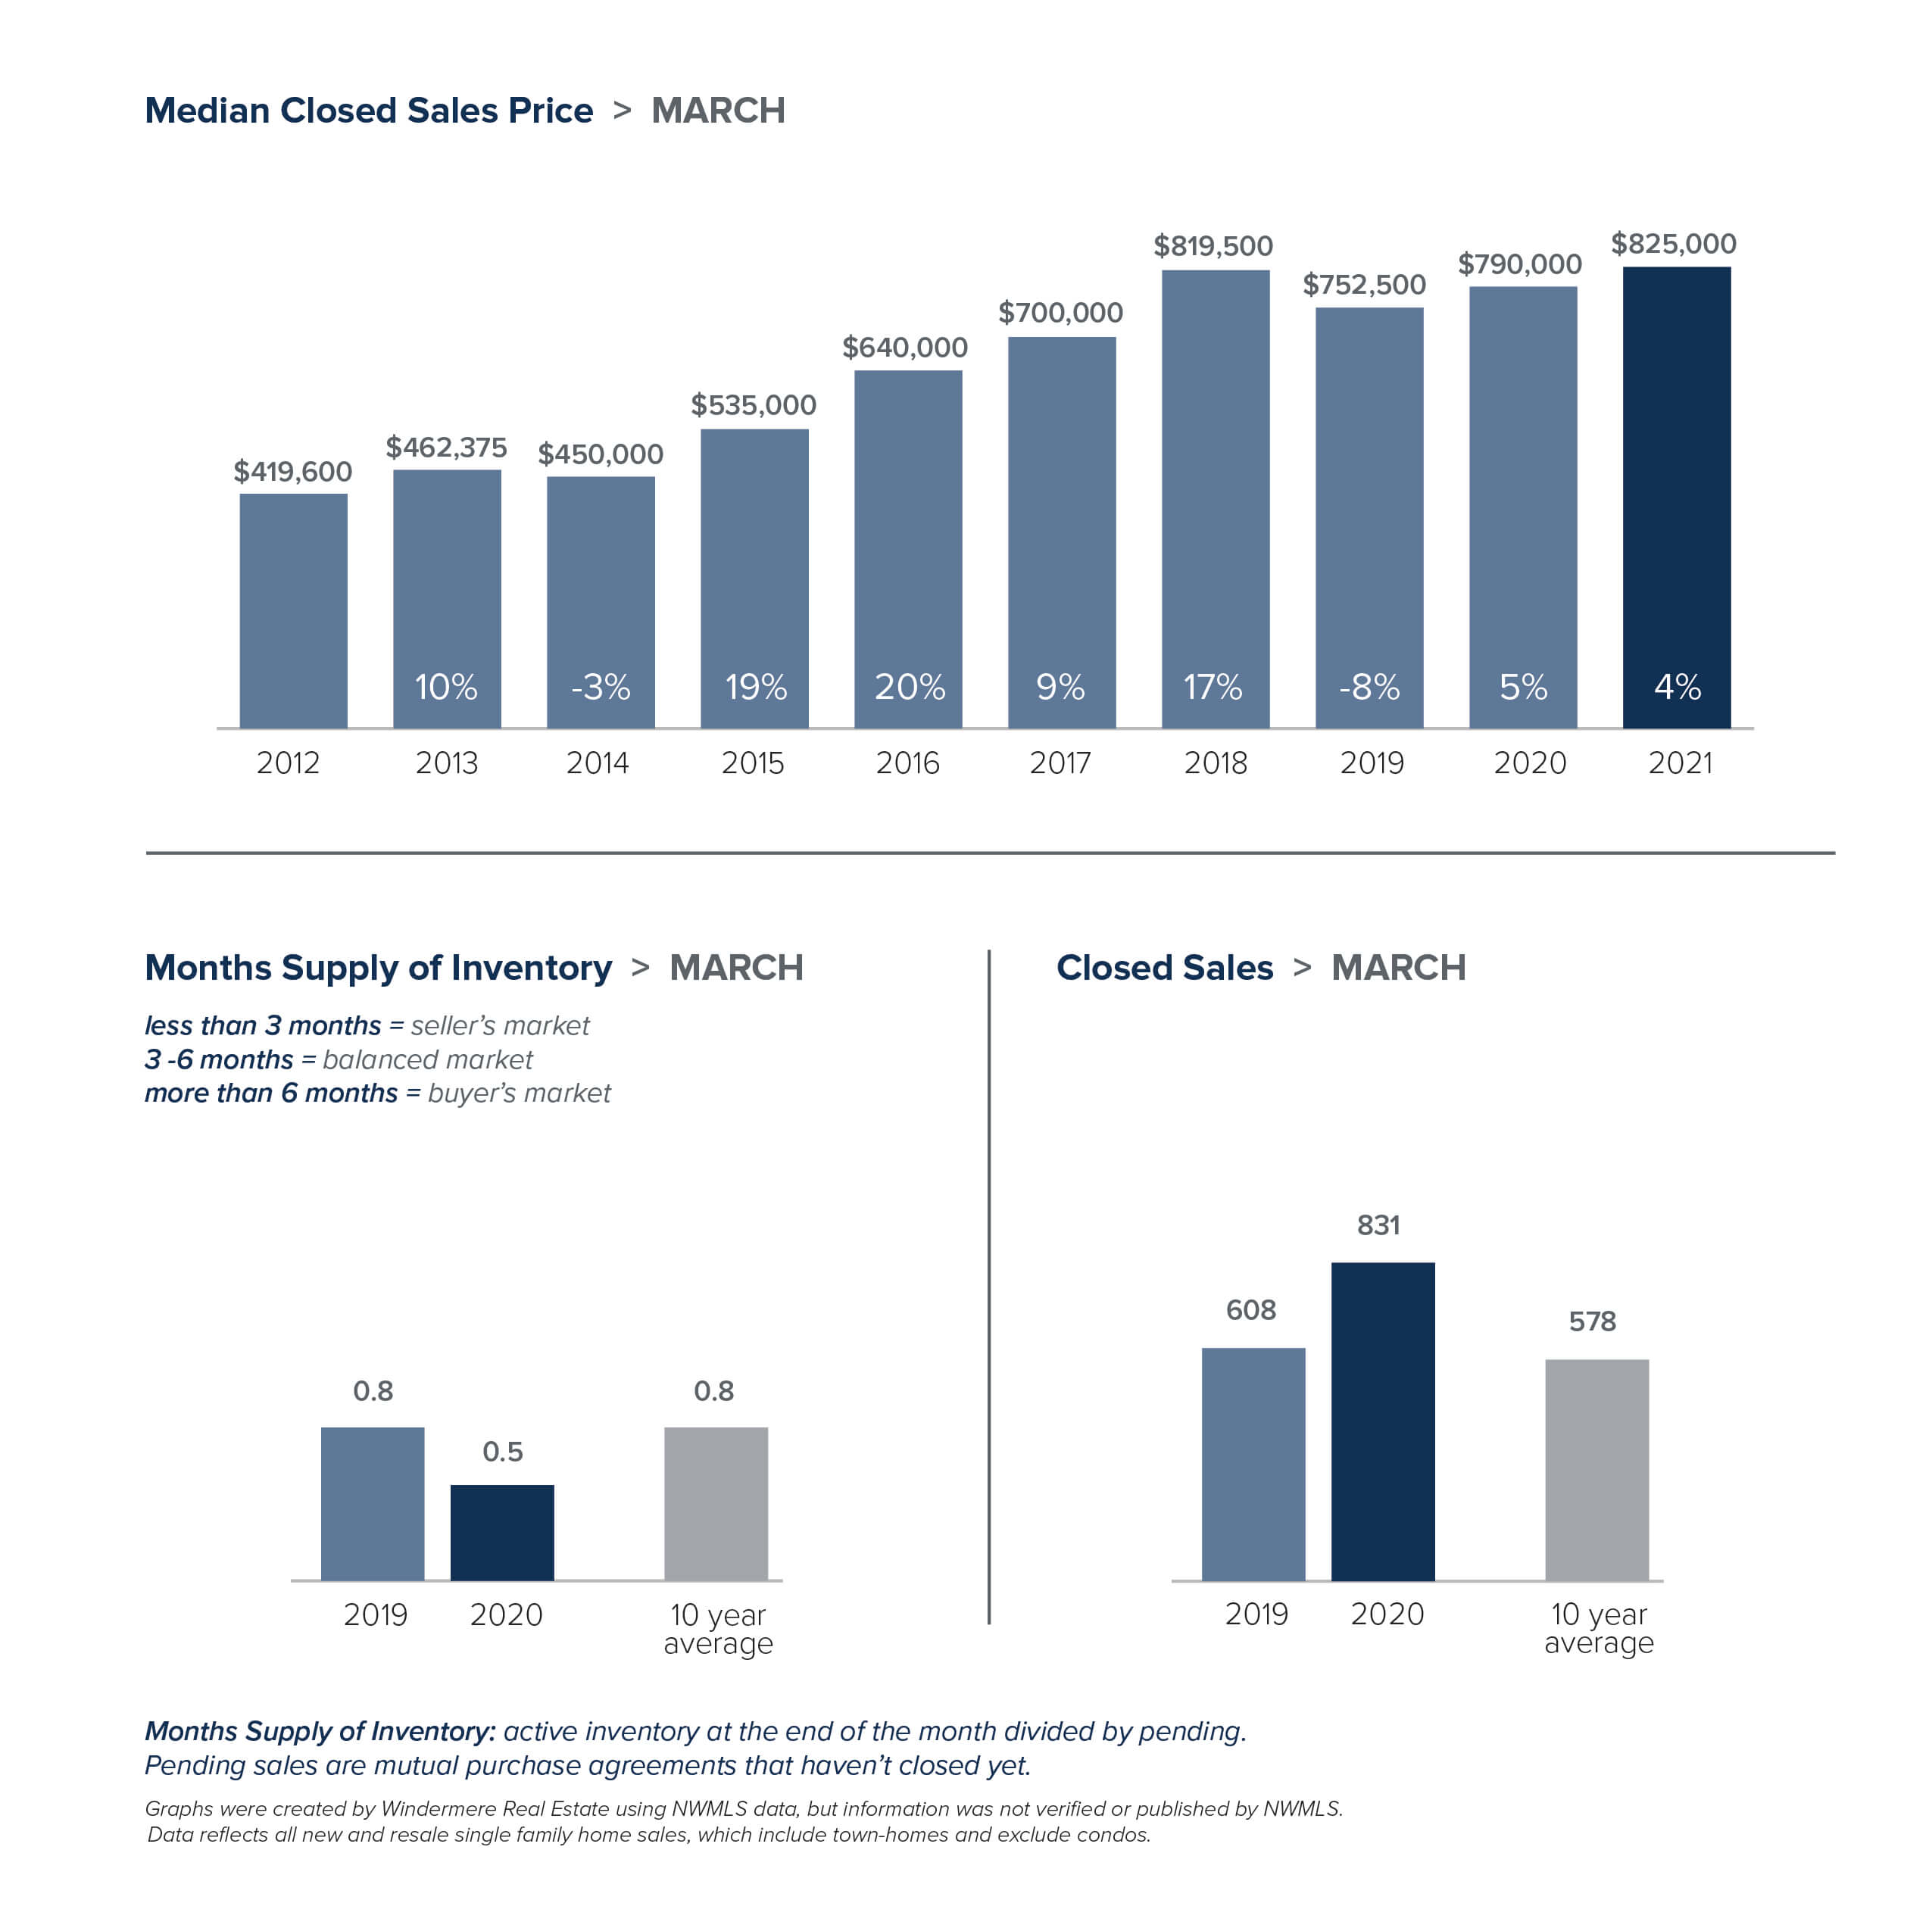
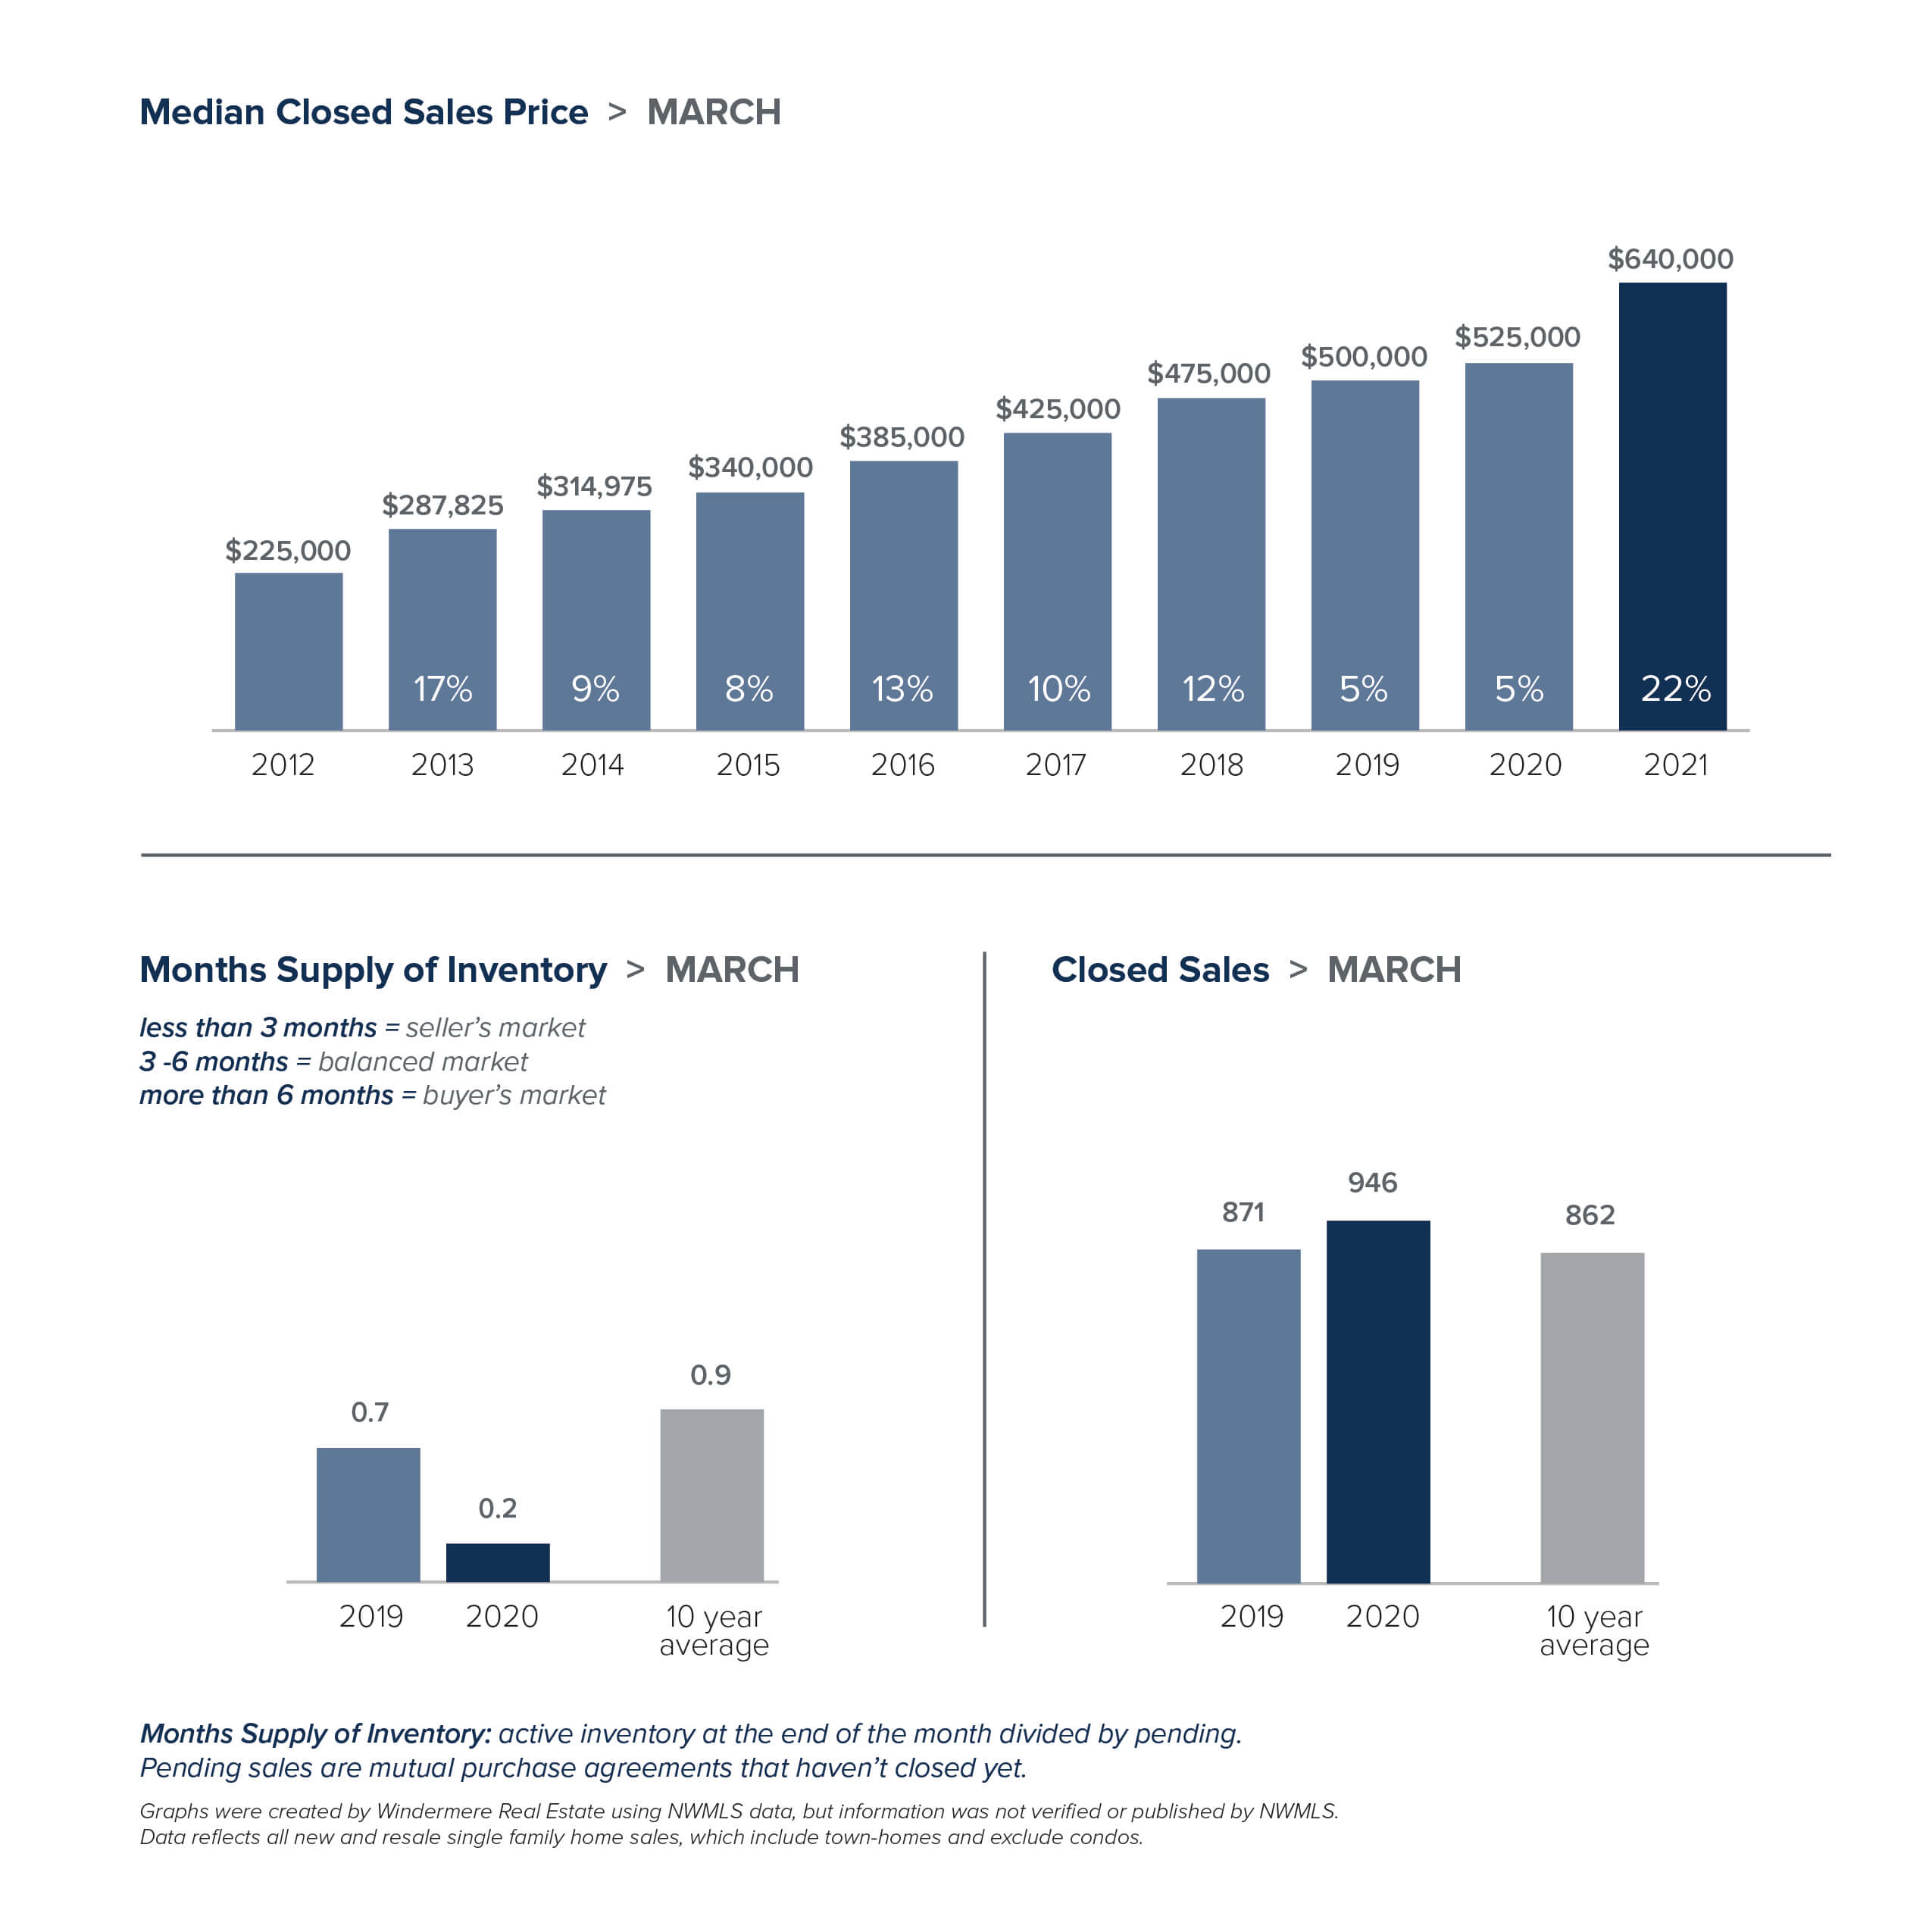
The drop in the number of listings was profound. In King County there were 54% fewer single-family homes on the market at the end of March than the same time a year ago. The Eastside had 68% fewer listings. There were just 216 homes for sale on the Eastside, which stretches from Issaquah to Woodinville. Extensive new investments there, including Amazon’s plan to add 25,000 jobs in Bellevue, will only increase demand for housing. North King County, which includes Richmond Beach and Lake Forest Park had just 26 homes for sale. In Seattle, the 498 listings there represents a drop of 18% from a year ago. Despite the comparatively greater number of listings, Seattle still has only two weeks of available inventory. The situation was even more dire in Snohomish County. With the number of homes for sale down 68%, the county has just one week of inventory.
So why is inventory so low? The pandemic certainly has played a part. People now working from home have bought up properties with more space in more desirable locations. Nervousness and uncertainty about COVID compelled many would-be sellers to postpone putting their home on the market. Downsizers who may have moved into assisted living or nursing homes are staying in place instead. But there are other factors as well.
For more than a decade, less new construction has been built relative to historical averages, particularly in the suburbs. Interest rates have also been a factor. Windermere Chief Economist Matthew Gardner noted, “I think a lot of the urgency from buyers is due to rising mortgage rates and the fear that rates are very unlikely to drop again as we move through the year, which is a safe assumption to make.” Homeowners who refinanced when rates were at record lows are staying in their homes longer, keeping more inventory off the market. And those same low interest rates have compelled many homeowners who bought a new home not to sell their previous one, but to keep it as a rental property.
While the number of listings tanked, the number of sales skyrocketed. That’s the recipe for soaring home prices. Housing prices here have been growing at the second-fastest rate in the nation for a full year. Nearly every area of King County saw double-digit price increases, with the exception of Seattle. In King County the median price for a single-family home in March was a record-high $825,000, up 15% from a year ago and an increase of 10% from February. The median home price topped $1 million for every city on the Eastside, where the overall median price surged 30% to $1,350,000, the highest median price ever recorded for the area. Seattle homes prices were also record-breaking, rising 4% to $825,000. Snohomish County prices set yet another all-time high as the median home price jumped 22% to $640,000.
The appeal of our area just keeps growing. For the second time, Washington took the No. 1 spot in the U.S. News Best States ranking – the first state to earn the top ranking twice in a row. The bottom line: the local real estate market is extremely competitive, and it shows no signs of slowing down. Successfully navigating today’s market takes a strong plan. Your broker can work with you to determine the best strategies for your individual situation.
The charts below provide a brief overview of market activity. If you are interested in more information, every Monday Windermere Chief Economist Matthew Gardner provides an update on the US economy and housing market. You can get Matthew’s latest update here.