
How will rising foreclosures impact the U.S. housing market? To give his answer, Windermere Chief Economist Matthew Gardner sheds light on the latest foreclosure data and shows how prepared home buyers are to manage their mortgage debt today compared to the 2000s.
This video on foreclosures is the latest in our Monday with Matthew series with Windermere Chief Economist Matthew Gardner. Each month, he analyzes the most up-to-date U.S. housing data to keep you well-informed about what’s going on in the real estate market.
Rising U.S. Foreclosures
The market has certainly shifted since mortgage rates started skyrocketing last year and, with prices pulling back across much of the country, some have started to become concerned about the likelihood of foreclosures rising—clearly a timely topic given current circumstances.
Hello there! I’m Windermere Real Estate’s Chief Economist Matthew Gardner and for this month’s episode of Monday with Matthew, I pulled the latest data on foreclosure starts and looked and the quality of mortgages that have been given to buyers in order to give you a clear idea of how foreclosures will impact the overall housing market.
For the purposes of this exercise, I’m going to concentrate on foreclosure starts rather than foreclosure filings because data shows us that a majority of homeowners where a foreclosure filing has been submitted to a court by their lender are able to avoid it by refinancing or selling the home, which makes total sense as over 93% of owners in the U.S. have positive equity.
U.S. Foreclosures: Starts 2007-2022
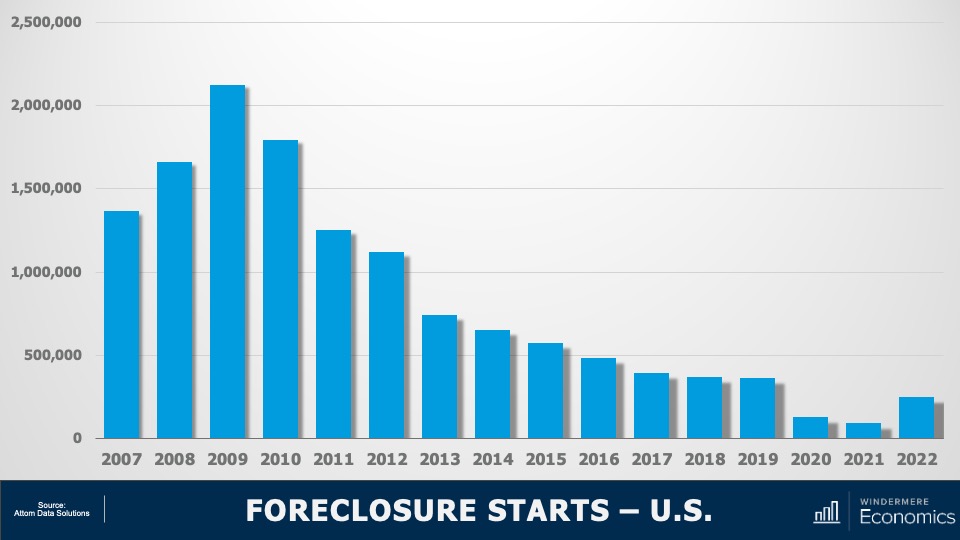
As you can see here, foreclosure starts rose significantly last year. In fact, they were 181% higher than in 2021. But if we zoom out, it’s important to note that foreclosure starts were 31% lower than 2019 and 88% lower than the 2009 peak.
Am I surprised at the increase in foreclosure starts? Not really. The forbearance program was put in place at the start of the pandemic, and it allowed homeowners to temporarily stop making mortgage payments and not be foreclosed on, but that program ended 18 months ago.
And, although a vast majority of the 4.7 million households who entered the program have left it and sold or refinanced their homes, there were always going to be some who were not able to, and this has led to the overall foreclosure activity rising. Let’s take a closer look.
U.S. Foreclosures in 2022

This is a heat map of foreclosure starts by state. And you can see that California, Florida, and Texas saw the highest numbers in 2022. But remember that these are the states that have the greatest number of homes with mortgages so, statistically, we would expect the total number of homes in foreclosure in those states would be higher than the rest of the country. That said, foreclosure starts were significantly higher in Florida, California, Texas, and New York than they were in 2019, the last “pre-COVID” year and before the forbearance program started.
And when we look more myopically, metro areas including New York/New Jersey, Washington DC, the Delaware Valley, Atlanta, Miami, Baltimore, and Dallas all saw total foreclosure starts rise well above what they were in 2019. This may suggest that there are some markets that could see foreclosure activity rise to a level that could materially impact housing in those locations.
But looking at the country as a whole, there are other factors leading me to believe that we will not see the number of homes entering foreclosure rising above the long-term average, and certainly not sufficient to have a material impact on U.S. housing prices.
Let me show you what’s happening on the mortgage side of things. First: credit quality.
Median FICO Scores for New Mortgages 2003-2022

The median FICO score for new mortgages was 766 in the 4th quarter of 2022. Yes, this is down from the peak seen in early 2021 when it was a whopping 788 but as shown here, it’s far higher than we saw before the housing crisis. Buyers over the past several years had very good credit and, given the tight labor market, we are certainly in a very different place than back before the housing bubble burst.
Mortgage Debt Payments Percentages 2007-2022

Secondly, buyers are using larger down payments than in the mid-2000’s, and with the historically low mortgage rates that we saw during the first two years of the pandemic benefitting new buyers as well as allowing existing homeowners to refinance, the share of disposable income that is used to cover mortgage payments remains very low. This basically means that owners aren’t as burdened by their house payments as they were in 2007-2009. And finally…
Equity Rich Households Q4 2022

With the significant run-up in housing values that we have seen over the past few years, 48% of all homeowners with a mortgage have more than 50% equity. Although this share has pulled back a little as mortgage rates rose and values pulled back, it’s still a massive amount of money and, as I mentioned earlier, many homeowners who are faced with foreclosure will end up selling their homes as they still have positive equity rather than go through the foreclosure process.
So, my answer to those of you wondering if we will see foreclosures rise to a level that could impact the overall housing market is “no.”
I don’t see any reason to believe that distressed sales will hurt the market in general, but I will say that there are some local markets where distressed sales could rise to levels that could act as a headwind to price growth in these areas. As always, I’d love to get your thoughts on this topic so please comment below! Until next month, take care and I will see you all soon. Bye now.
To see the latest housing data for your area, visit our quarterly Market Updates page.
About Matthew Gardner
As Chief Economist for Windermere Real Estate, Matthew Gardner is responsible for analyzing and interpreting economic data and its impact on the real estate market on both a local and national level. Matthew has over 30 years of professional experience both in the U.S. and U.K.
In addition to his day-to-day responsibilities, Matthew sits on the Washington State Governors Council of Economic Advisors; chairs the Board of Trustees at the Washington Center for Real Estate Research at the University of Washington; and is an Advisory Board Member at the Runstad Center for Real Estate Studies at the University of Washington where he also lectures in real estate economics.

You’ve seen “For Sale” signs around your neighborhood, but what does it take to actually put your home on the market? First-time home sellers often enter the selling process unaware of what’s to come, their heads full of questions. Understanding the selling process will inform your conversations with your real estate agent and will help you stay organized and on schedule as you sell your home for the first time.
8 Tips for First-Time Home Sellers
1. Know the Costs of Selling a Home
Though you’ll eventually walk away from the sale of your home with a lump sum in your pocket, the selling process isn’t without its costs. Real estate agent commission costs typically account for five to six percent of the sale price, but they’re not the only expense you’ll encounter on your selling journey. Between repairs, home upgrades, staging, escrow fees, Capital Gains Tax and more, it’s important to budget for these costs before listing your home.
2. Find the Right Agent
A successful selling experience starts by working with a professional real estate agent. Real estate agents specialize in keeping up with local market conditions, they have the tools to competitively price your home, and they understand what is driving buyer interest in your area. But beyond these qualities, it’s important that first-time home sellers choose an agent who understands their goals and cares about their happiness. Selling a home can be an emotional roller coaster and having a trusted expert beside you will help you navigate its ups and downs.
3. The Importance of Home Staging
Whether you hire a professional or decide to stage your home yourself, what’s important is that you make the commitment. Staging your home creates universal appeal, capturing the attention of the widest possible buyer pool. If your interior is too personalized, it makes it harder for buyers to see themselves in your home. Staging makes financial sense as well, as it often equates to higher sales prices. According to a 2020 survey performed by the Real Estate Staging Association (RESA®), of the 13,000 homes surveyed, 85% of staged homes sold for 5-23% over list price.1
4. High ROI Remodeling Projects
Remodeling projects cost a significant amount of money; there’s no way around it. This is where your agent’s expertise can help you spend wisely: they can inform you of which home features and upgrades are driving buyer interest in your area. Target the high ROI remodeling projects that increase home value to get the most bang for your buck and know which remodeling projects to avoid when selling your home.

Image Source: Getty Images – Image Credit: Hispanolistic
5. Pre-Listing Inspection
Anything that could potentially give your home a competitive advantage over other listings is worth discussing with your agent. One such strategy is conducting a pre-listing inspection before putting your home on the market. Not only do pre-listing inspections give sellers a better understanding of what repairs may be in order, but they also streamline the selling process by transparently disclosing the details of a property’s condition to the buyer. These reports are especially helpful in competitive markets, since buyers are more likely to waive inspections.
6. How to Price Your Home
Of all the information coming at you during the selling process, you’ll likely have your mind set on getting the best price for your home. Determining home value is one area where real estate agents excel; their Comparative Market Analysis (CMA) will help them set an accurate and competitive figure. It’s important to separate your emotional attachment to your home from your agent’s calculations. In your mind, your home possesses a certain value, but that may not match what it can realistically fetch on the market. Sometimes it may be even more than you thought!
7. Safety Tips for Open Houses
The more buyer interest you’re able to drum up, the better. Open houses play an important role in the selling process in that they allow buyers to experience the property firsthand. Making this connection requires opening your doors to strangers, which is cause for taking the appropriate safety measures. Remove all prescriptions from your medicine cabinets, lock up precious belongings and personal information, make sure all doors and windows are locked at the end of each day, and discuss your buyer screening process with your agent so you’re on the same page.
8. Moving Timeline
The planning doesn’t stop once you’ve sold your home. Before the ink is dry on your real estate contract, your gears will be turning about how to efficiently move into your new home. We’ve created an interactive Moving Checklist with a step-by-step guide to the moving process, from twelve weeks before moving day all the way up until you make your move. The list is also available as an interactive web page and downloadable PDF here:
For more information on the selling process from list to closing, visit our comprehensive selling guide here:
1: Real Estate Staging Association (RESA®). “The Consumer’s Guide to Real Estate Staging.” Realestatestagingassociation.com. 2020.
Featured Image Source: Getty Images – Image Credit: Hispanolistic
This post originally published by Sandy Dodge
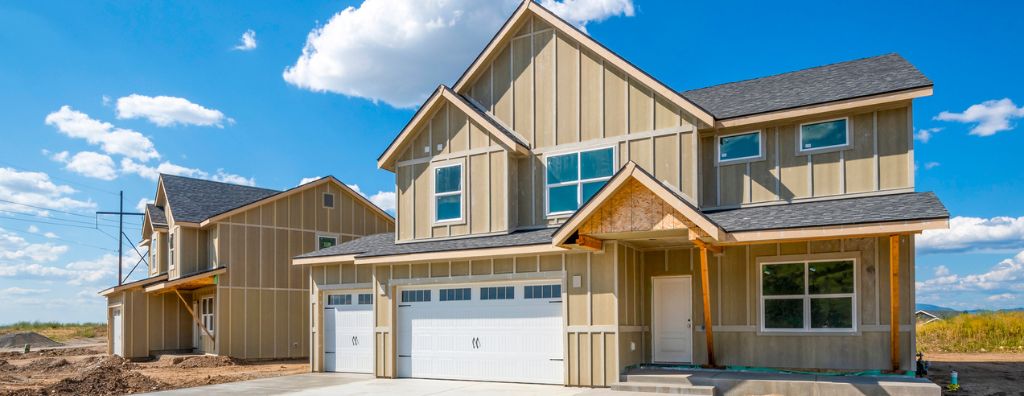
You’ve got several options to choose from when buying your next home. With existing homes, it’s in sellers’ best interest to spruce up their properties, so they’ll usually complete some kind of upgrades, curb appeal projects, and remodeling before hitting the market. A new construction home, however, has no previous owner; it comes brand new. Learning about the new construction buying process will help you understand how it differs from other types of housing, such as existing single-family homes, townhouses, condominiums, etc.
What is a new construction home?
New construction homes are kick-started from two primary sources: the homeowners themselves and developers. When a homeowner is having a home custom built, they work with contractors to build it to their desired specifications on a lot they’ve purchased. This tailored approach comes at a price; building a custom home generally costs more than purchasing a new build from a developer.
When going the developer route, buyers have options to choose from, namely tract homes and spec homes.
Tract homes make up new neighborhoods on land bought by the builder. They bear a strong resemblance to each other but may offer customizable floor plan and design options to tailor the home to the buyer’s liking.
Spec homes are finished, move-in-ready new builds. Though they offer little to no customization, they may be the right option for you if you’re looking to move right away.
There are four component parts of building a new construction home: land, labor, materials, and regulation. Builders combine those costs to determine what price they need to sell the home to make a profit, accounting for local real estate market trends. However, if the market is driving up those costs, builders are less likely to continue building. As a buyer, keeping tabs on the housing market will help you understand the landscape of available new construction homes.
Pros of a New Construction Home
- New materials, appliances, and fixtures
- Customization without having to remodel
- Less maintenance than an older home
Cons of a New Construction Home
- Custom home costs can be high
- Move-in date dictated by builder’s timeline
- Market conditions can drive up prices/halt production
Buying a New Construction Home
The financial preparations you’d take for purchasing an existing home apply to buying a new construction home. You’ll get pre-approved for a mortgage early on and form a saving strategy for how to make a down payment.
There’s less room for negotiation in new construction home transactions, so you and your agent should thoroughly discuss what kind of offer you’re able to make. Your agent is your greatest asset during this part of the process; lean on them to understand how to make an offer. You’ll also want to know whether a home warranty comes with the purchase of the new construction home and its cost structure.
Even though these homes are brand new, it’s still worth it to get a home inspection to discover any outstanding repairs that need to be made and begin a dialogue with the builder about fixing them before you move in.
Going into the buying process, it helps to know which new construction homes you’re able to afford. This allows you and your agent to work together to find the best candidate properties. To get an idea of what’s affordable, use our free Home Monthly Payment Calculator by clicking the button below. With current rates based on national averages and customizable mortgage terms, you can experiment with different down payment amounts to get estimates of your monthly payment for any listing price.
Featured Image Source: Getty Images – Image Credit: Kirk Fisher
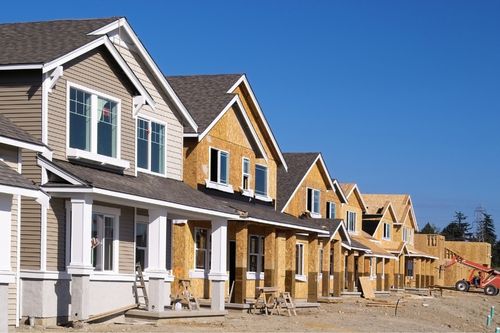
Image Source: Getty Images – Image Credit: jhorrocks
Pros of a New Construction Home
- New materials, appliances, and fixtures
- Customization without having to remodel
- Less maintenance than an older home
Cons of a New Construction Home
- Custom home costs can be high
- Move-in date dictated by builder’s timeline
- Market conditions can drive up prices/halt production
Buying a New Construction Home
The financial preparations you’d take for purchasing an existing home apply to buying a new construction home. You’ll get pre-approved for a mortgage early on and form a saving strategy for how to make a down payment.
There’s less room for negotiation in new construction home transactions, so you and your agent should thoroughly discuss what kind of offer you’re able to make. Your agent is your greatest asset during this part of the process; lean on them to understand how to make an offer. You’ll also want to know whether a home warranty comes with the purchase of the new construction home and its cost structure.
Even though these homes are brand new, it’s still worth it to get a home inspection to discover any outstanding repairs that need to be made and begin a dialogue with the builder about fixing them before you move in.
Going into the buying process, it helps to know which new construction homes you’re able to afford. This allows you and your agent to work together to find the best candidate properties. To get an idea of what’s affordable, use our free Home Monthly Payment Calculator by clicking the button below. With current rates based on national averages and customizable mortgage terms, you can experiment with different down payment amounts to get estimates of your monthly payment for any listing price.
Featured Image Source: Getty Images – Image Credit: Kirk Fisher

This video is the latest in our Monday with Matthew series with Windermere Chief Economist Matthew Gardner. Each month, he analyzes the most up-to-date U.S. housing data to keep you well-informed about what’s going on in the real estate market.
Renting vs. Buying a Home
One of my followers asked me about some of the financial benefits of owning your home as opposed to renting. I find this topic interesting as there really is a “laundry list” of reasons that, from a financial standpoint, owning a home is better than renting.
I’m Matthew Gardner Chief Economist at Windermere Real Estate and welcome to this month’s episode of Monday with Matthew. Let’s get to the topic at hand. Of course, I don’t have time to go through them all today but here are the ones that I think are the most compelling: wealth building and tax benefits.
The Financial Benefits of Homeownership
The first thing to understand is that, over time, a mortgage becomes easier to afford. You see, when you buy a home, the mortgage payments themselves don’t change and, over time, your earnings rise but the mortgage payment doesn’t. Simply put, unlike renters who generally see their rents going up every year, your mortgage payment never will and because you’ll hopefully be making more money as time goes by, the share of your income that you spend on a mortgage payment becomes less & less.
The next advantage to owning your home is that it is a good long-term investment. Of course, some will say that this is not the case because we went through the housing bubble bursting back in 2006 but there have actually been very few times in history when home prices have seen any long-term downward adjustment.
Now I know some will say that investing in stocks would give you a higher long-term return. My response to that would be I’ve never seen anyone living under a stock certificate. Have you?
My next reason for believing that ownership is better than renting is rather simple, and that is because a portion of every mortgage payment you make goes toward reducing the principal amount of the loan. Of course, during a majority of the term of the mortgage most of the payment is going towards interest but, a small portion is paying down the debt itself—in essence making it a forced savings plan, building wealth along the way.
Tax Advantages of Owning a Home
But what about the tax advantages? Owning a home offers unique and substantial ways to save on your taxes every year. Firstly, you can deduct your real estate taxes every year. Now, tax reform has limited the total allowed deduction, but it is still meaningful. You can also deduct the interest you pay on your mortgage. Again, there are some limitations but, depending on where you live you could save a significant amount.
And finally, let’s talk Capital Gains Taxes. When you sell your primary residence and have seen its value grow since you purchased it, up to $250,000 of that profit (if you’re a single person) or $500,000 if you’re married and filing jointly is tax free. Now, this is only true if you meet certain requirements with the biggest one being that you have to have lived in the house for a minimum of two years during the preceding five-year period.
If that’s not enough to convince you that there are very significant advantages to owning a home over renting, I will leave you with one last datapoint that you may find of interest.
Renting vs. Owning a Home: Household Net Worth
Using Federal Reserve data as a base, I’ve been able to calculate the median net worth of a household in America who owned their homes versus a household that rents.
- In 2022, the median household wealth of a homeowner household here in America was approximately $330,000.
- The median household wealth for a renter household in this country last year was just $8,000.
As you can see, that’s quite the discrepancy between the two. I think it’s very clear that homeownership for a vast majority of families is how they create most of their wealth.
I hope you found this topic of interest. Of course, if you have any questions or comments please do let me know as I do enjoy hearing from you. Take care and I look forward to talking to you all again next month.
Data combined and calculated by Windermere Economics
About Matthew Gardner
As Chief Economist for Windermere Real Estate, Matthew Gardner is responsible for analyzing and interpreting economic data and its impact on the real estate market on both a local and national level. Matthew has over 30 years of professional experience both in the U.S. and U.K.
In addition to his day-to-day responsibilities, Matthew sits on the Washington State Governors Council of Economic Advisors; chairs the Board of Trustees at the Washington Center for Real Estate Research at the University of Washington; and is an Advisory Board Member at the Runstad Center for Real Estate Studies at the University of Washington where he also lectures in real estate economics.

Deciding when to sell your home can depend on a variety of factors. Perhaps your local market conditions are favorable to sellers, or you’ve recently changed jobs, or your family is growing and you need to upsize. Whatever the case may be, making the decision to sell your home is the first step in your selling journey.
Deciding to Sell Your Home
Once you know it’s time to sell your home, it’s natural to feel a wave of emotions. A home is an integral part of a homeowner’s life. They provide countless memories and, for many homeowners, are their greatest investment. But once you’ve decided to sell, it’s important to look at your home with an objective eye to appeal to a wide variety of buyers.
Which repairs should I make before selling my home?
To get your house in top selling shape, identify its outstanding repairs. As you fill out your list, separate the projects into categories which are DIY-eligible and which require a professional. This will help you to budget for your overall repair expenses and build a reasonable timeline. Some of the most important repairs to make before listing your home include fixing appliances, making sure your sinks and faucets work properly, repairing any cracks or holes in the walls, fixing all leaks and water damage, and ensuring that all systems in the home are functioning properly. Making repairs before you list your home will bode well for home inspections, negotiations, and can even give your home an advantage over other listings. Your agent may suggest a pre-listing inspection to make your home more competitive in a seller’s market.
Which upgrades should I make before selling my home?
When you sell your home, you’re inevitably competing against other listings in your area. The aesthetics of a house play a significant role in its ability to catch buyer’s attention, which emphasizes the importance of improving your curb appeal as you prepare to hit the market. Landscaping projects, new exterior paint, and upgrading your front entry are just a few ways you can spruce up the outside of your home.
And what about the interior? Consider upgrading to energy-efficient appliances, which are known for their high ROI potential. This is a great time to repaint your home’s interior as well. Consider using a neutral color palette to make it as appealing as possible to a wide-array of buyers. It’s also a good idea to identify rooms in which the flooring should be replaced or repaired. When remodeling your home’s flooring, choose a material that is within budget and has good resale value.
Working With an Agent
Listing agents are trained professionals who work with homeowners to sell their homes. Your listing agent will be there to answer any questions you may have throughout the selling process and will negotiate with buyer’s agents to get the best price for your home. But their value doesn’t stop there. A listing agent will list the home, coordinate showings and open houses, and market the home. When searching for a real estate agent, find someone with whom you are compatible both emotionally and professionally, and who cares about the goals of you and your household.
What’s my home worth?
Homeowners can get a general idea of how much their home is worth by using online home value estimators, like Windermere’s free Home Worth Calculator. Though these tools can provide some context behind the value of your home, nothing compares to the in-depth analysis of an agent’s Comparative Market Analysis (CMA). Using a CMA, an agent can accurately price your home to get it sold quickly.
For more information on your local housing market and how to sell your home, connect with a Windermere agent today by clicking on the button below.
Featured Image Source: Getty Images – Image Credit: Inside Creative House
This post originally published by Sandy Dodge

Throughout the home buying process, you’ll encounter several checkpoints. At every stop, you’ll get closer to the ultimate goal of purchasing your next home. Each one satisfies unique criteria required to become a homeowner, and each one has its own terminology. Before you begin your home buying journey, it’s helpful to know about pre-approval, pre-qualification, and proof of funds, and the role they play in a real estate transaction.
Pre-Qualification and Pre-Approval
What is pre-qualification?
Pre-qualification and pre-approval go hand in hand, but one precedes the other. Pre-qualification is a very early step in the home buying process leading to pre-approval. After sharing your financial information with your bank or lender, they’ll give you an estimate of the loan amount you can expect to qualify for. During this time, you’ll learn about the different home loans available to you to help you decide which is best. Pre-qualification usually only takes a few business days.
What is pre-approval?
A sibling to pre-qualification, pre-approval takes things a step further. Once you submit a mortgage application, you’ll provide your lender with the required information to perform a financial background check to assess your creditworthiness. You’ll get a pre-approval letter showing the lender’s offer of a specific loan amount, so you’ll know how much you can borrow. You’ll also get a better understanding of what interest rate you can expect to pay on your loan. Mortgage pre-approvals are typically valid for 60 to 90 days.
More information on the benefits of pre-approval and when to get pre-approved:
Once you’ve gone through the pre-approval process, it’s helpful to know which homes you can afford. Use our free Home Monthly Payment Calculator by clicking the button below. With current rates based on national averages and customizable mortgage terms, you can experiment with different values to get an estimate of your monthly payment for any listing price.

Image Source: Getty Images – Image Credit: Thitiphat Khuankaew
What is a proof of funds letter?
Simply put, in real estate, a proof of funds letter is a document that proves to the seller that you have enough money available to purchase the home. Proof of funds letters may vary depending on the terms of the transaction. For example, if you’re making an all-cash offer, your letter will prove that you have enough liquid cash to complete the deal.
For more information on the home buying process, read our blog post on searching for a home:
How to Search for a Home: Buying Guide
Featured Image Source: Getty Images – Image Credit: mixetto
This post originally published by Sandy Dodge

There’s always room for improvement in a household’s quest to go green. From how you use your appliances to the way you consume and dispose of food, every lifestyle choice you make at home presents an opportunity to be more eco-friendly. Adopting more sustainable practices has obvious environmental benefits and helps to improve quality of life, but it can also increase your home value and in some cases may generate extra cash.
7 Tips for Sustainable Living at Home
1. Create a Sustainable Kitchen
The kitchen is responsible for a decent portion of your home’s energy output. Choosing energy-efficient appliances can help to improve your household’s sustainability by using less energy. Reusable materials go a long way in the kitchen as well. Even seemingly small changes like switching from single use to reusable grocery bags and eliminating paper towels can make an impact. Using natural cleaning products will keep your kitchen cleaner longer while improving your home’s air quality, and being mindful about water usage can save on utility bills.
2. Plant an Herb Garden
To further improve your home’s sustainability, consider planting an herb garden. This helps to cut down on repeatedly buying spices and seasonings at the grocery store while cultivating a natural ambience in your home. (And they’re fun to cook with, too!) Do indoor plants need sunlight? Of course, so be sure to position your indoor garden in an area where your plants have direct access. Once you’ve picked out a spot, decide which herbs you’d like to grow. Some of the most common herbs are easy to grow and will pair well with whatever’s on the menu—basil, thyme, cilantro, parsley, oregano, etc.
3. Tips for a More Energy Efficient Home
The first step in becoming more energy efficient at home is understanding your energy output. Once you understand your household’s habits, you can identify which cutbacks will help you chart a more sustainable path forward. Energy-efficient lightbulbs can help you save on utility bills. Because they use less energy that standard lightbulbs, they typically last longer as well. Make sure your home is properly insulated and your windows’ caulking and weatherstripping is in good condition. Air leaks and poor insulation waste energy and will cause spikes in your utility bills.

Image Source: Getty Images – Image Credit: Nattakorn Maneerat
4. Reduce Waste at Home
Every household produces some sort of waste, but it’s how that waste is treated that makes all the difference for the environment. Clean your recycling to make it easier to process and do your best to only buy what you plan to eat. Start a compost bin for extra food scraps or consider other agricultural solutions for disposing of it. Consider buying items like shampoo, conditioner, moisturizers, and the like in bulk to cut down on packaging waste. Reusable glass containers or jars will help you portion out meals and provide a useful way to store bulk items like rice and beans.
5. Use Solar Energy
Yes, making the switch to solar energy comes with significant upfront costs. But an investment in solar is not just an investment in the health of the planet, it can increase your home value as well. The energy savings you’ll generate in the long-term will depend on your household’s level of consumption and the power generated by your solar panels. And if you’re generating more power than you’re consuming, you may be able to sell the surplus energy back to the grid. For more information on solar-based incentives and tax breaks by state, visit DSIRE (Database of State Incentives for Renewables & Efficiency®).

Image Source: Getty Images – Image Credit: ArtistGNDphotography
6. Sustainable Gardening Best Practices
Even for the green thumbs, there’s opportunity to go greener at home. A garden is only as healthy as its soil. Mulching is vital to soil health and helps to reduce weed growth. Animal manure also has the power to enrich garden soil, both as a fertilizer and conditioner. Organic weed killers made with natural ingredients will maintain your garden’s health while keeping unwanted weeds at bay. Apply this same organic mindset to dealing with slugs as well. Certain types of slug bait may possess certain chemicals that do more harm than good, especially if you have farm animals on your property like chickens or goats.
7. Sustainable Laundry Room Tips
Before you begin your next cycle in the laundry room, consider some methods of reducing energy. Because the heating of water is responsible for a majority of the energy generated by doing laundry, using cold water can help you save on energy costs. Cold water is also gentler on clothing. Clean the dryer vent and filter regularly to keep it unclogged and running efficiently. Consider hang-drying when possible, and in warmer months, air dry your clothes to save a dryer cycle.
For more information on sustainable living, helpful advice on home upgrades, plus tips on DIY home projects and more, visit the Living section of our blog.
Featured Image Source: Getty Images – Image Credit: monkeybusinessimages
This post originally published by Sandy Dodge

Nowadays, home staging is an integral part of the home selling process. The impact of home staging is crystal clear, but how you go about it deserves some consideration. Many homeowners will hire a home staging professional, trusting their expertise to make their home as appealing as possible to buyers. However, if hiring a professional isn’t in your budget, taking a DIY approach to home staging can deliver its own benefits.
How to Prepare for an Open House
Open houses are a major driver of buyer interest. Preparing for an open house is a matter of boosting curb appeal, cleaning, and staging to get your home in tip-top shape. It’s vital that you and your agent take certain safety precautions, given that you likely won’t be on sight when the open houses occur. Buyers often feel uneasy in the presence of the seller when touring a home. It also makes it more difficult for them to visualize the space as their own. Accordingly, it’s best to let your agent handle the open house. Here is a helpful list of how to prepare.
Staying Safe When Selling Your Home
- Go through your medicine cabinets and remove all prescription medications.
- Remove or lock up precious belongings and personal information. You will want to store your jewelry, family heirlooms, and personal/financial information in a secure location to keep them from getting misplaced or stolen.
- It is best to remove all family photos during the staging process so potential buyers can see themselves living in the home; it’s also a good way to protect your privacy.
- Check that your windows and doors are secure before and after showings. If an intruder is looking to get back into your home following a showing or an open house, they will look for weak locks or unlocked windows and doors.
- Consider extra security measures such as an alarm system or other monitoring tools like home security cameras.
Image Source: Getty Images – Image Credit: ferrantraite
Talk to your agent about the following safety precautions:
- Perform a thorough walk-through with your agent to make sure you have identified everything that needs to be removed or secured (medications, belongings, photos, etc.)
- Go over your agent’s screening process so you are both on the same page about how to qualify buyers before showings.
- Lockboxes to secure your keys for showings should be up to date. Electronic lockboxes track who has accessed your home.
- Go through your home’s entrances and exits and share important household information so your agent can advise you on how to secure your property while it’s on the market.
To connect with a local, experienced Windermere Real Estate agent, get started by clicking the button below:
This post originally published by Meaghan McGlynn

In the process of buying or selling a home, you’ll frequently come across the term “MLS.” The Multiple Listing Service (MLS) is a group of regional databases of homes for sale accessible only to real estate agents and brokers. Their ability to access the MLS makes it easier for buyers to find the right home and for sellers to market their listings.
What is the Multiple Listing Service (MLS)?
The purpose of an MLS is to facilitate real estate transactions by connecting real estate agents and making it easy for them to share information about active listings and sold home data. For buyers and sellers, your agent’s access to the MLS means you’ll be connected to the largest network of homes and listing information on the market.
Each MLS shows the homes for sale in a particular geographic area. Listing agents add their clients’ listings to the database—providing photos and detailed information about the property—so buyer’s agents can show them to their clients. The MLS allows for customizable searches, which agents use to easily identify the homes that match their clients’ criteria. The vast amount of historical data available on the MLS is what your agent will use to conduct their Comparative Market Analysis (CMA) to competitively price your home. The listing data in the MLS is fed to real estate brokerage websites, such as Windermere.com, so that buyers can search for homes on their own as well.

Image Source: Getty Images – Image Credit: fizkes
Benefits of the Multiple Listing Service (MLS)
Selling a home is a numbers game. The more potential buyers you can reach, the more likely you are to find the right buyer in a timely manner. After your agent conducts their CMA to determine the value of your home, they’ll upload the listing to the MLS. Here they can add additional information beyond what you would find in a typical listing description, such as showing times, contact information, and more. The MLS provides maximum visibility for sellers by connecting them to buyer’s agents who are actively searching for listings. The MLS has also helped to make the industry more equitable. Small real estate brokerages have access to the same MLS info as large companies, putting everyone on a level playing field.
What is an MLS number?
An MLS number is a unique code for each home listed on the market. It makes it easier for agents to communicate regarding a specific property. To learn more about the MLS, or for answers to your buying and selling questions, connect with a local, experienced Windermere agent today:
Featured Image Source: Getty Images – Image Credit: VioletaStoimenova

This video is the latest in our Monday with Matthew series with Windermere Chief Economist Matthew Gardner. Each month, he analyzes the most up-to-date U.S. housing data to keep you well-informed about what’s going on in the real estate market.
Hello there, I’m Windermere’s Chief Economist Matthew Gardner and welcome to this month’s episode of Monday with Matthew. A little while ago, a housing analyst was being interviewed about the current state of the residential market and they suggested that the country is in a “housing recession.” Well, needless to say, this got a lot of attention from the media and the public at large—for obvious reasons.
Any time the word “recession” is mentioned we almost subliminally cast our minds back to 2007. And when the word “recession” is combined with the word “housing,” then panic starts to set in with flashbacks of headlines about burgeoning housing supply, plummeting home prices, and surging foreclosures.
As this is a topic being discussed by many across the country right now, I wanted to share with you my opinion as to whether the phrase “housing recession” is an appropriate one when describing today’s market.
So, what is a recession? To answer this, I will turn to my trusted Oxford English Dictionary, and this is how they describe that word.
Definition of a Recession

Image Source: Matthew Gardner
Recession:
- a difficult time for the economy of a country, when there is less trade and industrial activity than usual, and more people are unemployed
- the movement backward of something from a previous position
Well, how do we use these definitions when it comes to the ownership housing market?
I guess that “less trade” could mean lower sales and we have certainly seen sales pull back. “Movement backward” could be how someone might describe the fact that sale prices have been pulling back in many markets across the country.
But although some may say that we really are in a housing recession given the definition of the word, is it really accurate? Are we are inextricably headed down a road that leads to the bursting of some sort of bubble as we all remember from 2007? I don’t believe we are. To explain my thinking let’s start out by looking at housing supply.
Inventory of Homes for Sale

Image Source: Matthew Gardner
Yes, listing activity is up—can’t argue with that—with the number of resale homes for sale jumping by more than a third from the start of this year. But there’s more to it than that. You see, we have to look a little further back to better understand what’s really going on.
And to do this, let’s check out the number of homes for sale during the first seven months of this year and compare those numbers to the same periods in 2018 through 2021.
Active Listings By Month

Image Source: Matthew Gardner
I don’t know about you, but this doesn’t look like a chart showing a massively oversupplied market! The number of homes for sale in July of this year was almost exactly the same as we saw last July and is still well below the levels seen in 2018, 2019, or 2020.
Sure, listings are up. But are we at levels that will cause prices to tumble? Remember that it was a massive increase in the number of homes for sale that led to the housing bubble bursting back in 2007. Listings peaked at almost 3.9 million units in 2006; but today there are 2.6 million fewer units on the market than we saw back then. Now that we’ve seen that supply isn’t at concerning levels, let’s look at demand.
Existing Home Sales

Image Source: Matthew Gardner
This chart doesn’t look too good. On an annualized basis, sales have been pulling back since the start of the year but that’s not the full story. Let’s look at this in a slightly different way.
Year-to-Date Sales

Image Source: Matthew Gardner
The bars here show year-to-date sales through July—both adjusted and unadjusted for seasonality—and although unadjusted sales so far this year are lower than we saw during the first seven months of 2021, they are at about the same level as we saw in 2018 and are higher than in 2019 or 2020.
But when we adjust the monthly sales data for seasonality, year-to-date sales in 2022 were higher than all years shown here other than 2021.
So, although sales have fallen, it appears to me that we are heading back to a more realistic market rather than one that is hemorrhaging. Yet another indicator we need to consider when examining the market for evidence of some sort of recession are months of inventory , which shows how long it would take to sell every home for sale using the current monthly sales pace.
Months of Inventory

Image Source: Matthew Gardner
This graph shows that it would take three months to sell every home on the market given the sales we saw in July. That is quite a jump from the January pace but, again, perspective is everything.
Months of Inventory: Seller’s Market
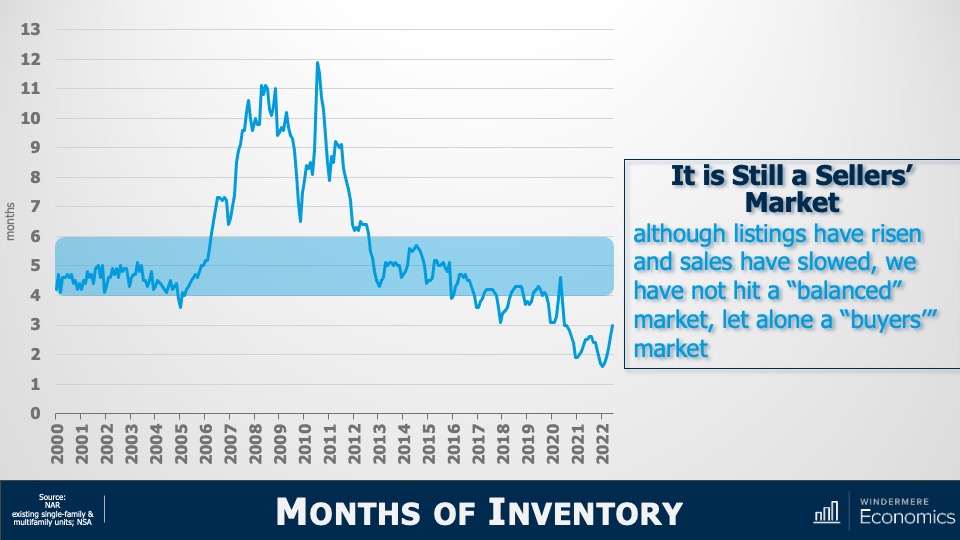
Image Source: Matthew Gardner
At three months, it is still a seller’s market. It’s generally accepted that the definition of a seller’s market is any number below four months; a balanced market is four to six months of inventory, and a buyer’s market is when the month of inventory is above six.
And a simple bit of math shows us that, for the market to shift from favoring sellers to favoring buyers, the number of homes for sale must break above two million—which we haven’t seen since 2015—and monthly sales would have to drop to below 300,000. We’ve only seen that happen three times in history: November 2008, and again in July and August of 2010.
Yes, listings are up, and sales are down. There’s no denying it. But, again, does the data justify the term recession? My answer would be no. But, if you’re still not convinced, let’s turn our attention to sale prices. I think that might help make things even clearer.
Median U.S. Existing Home Price
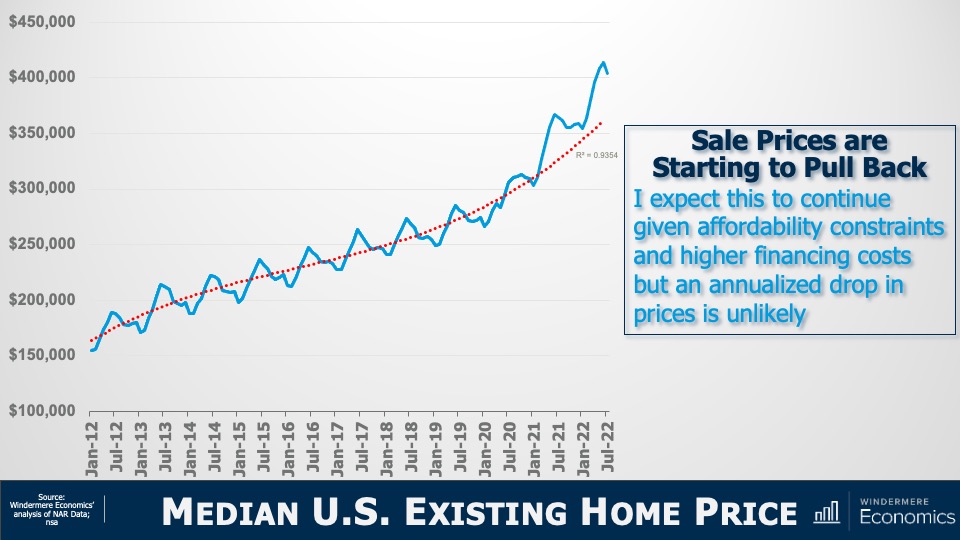
Image Source: Matthew Gardner
The solid line represents the median sale prices of homes over time and the dotted line shows the trend. You can clearly see that we started breaking away from the trend line in early 2021 and that’s not at all surprising as it started the month after mortgage rates hit their historic all-time low.
But today’s financing costs are significantly higher, and prices have started to slide. Although I certainly expect that we will see sale prices fall further, it appears to me as if they are simply moving back to the long-term trend, and not collapsing.
Mortgage Rate Forecasts
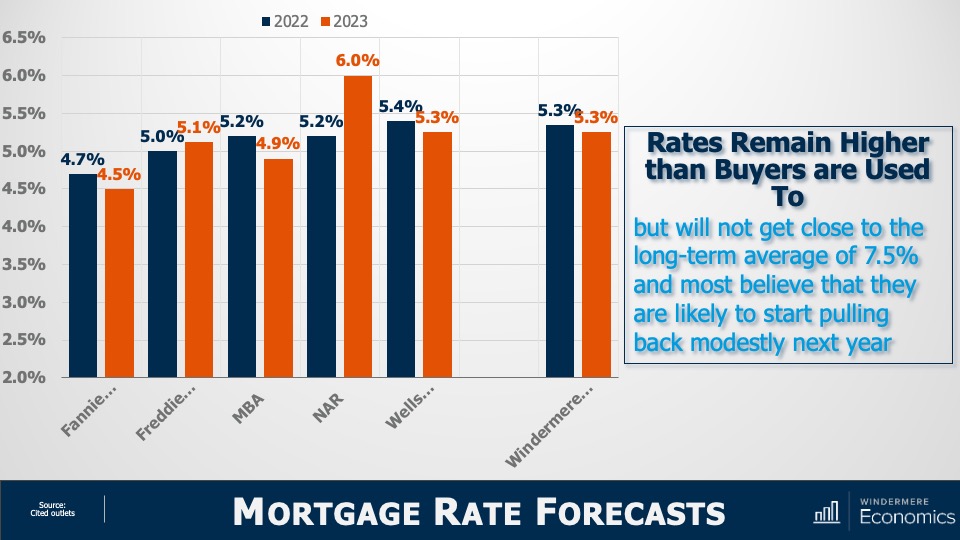
Image Source: Matthew Gardner
With mortgage rates doubling from their 2021 lows, downward pressure on sale price was to be expected. But will they—as some think—rise to a level that will cause home prices to plummet? To answer that, here are the forecasts of several associations. You’ll see that all, bar the National Association of Realtors and Freddie Mac, see rates pulling back—albeit modestly—in 2023.
Of course, all these are annual averages and today’s rates are higher with the latest Freddie Mac data showing the average 30-year fixed rate above 6%—a level we haven’t seen since 2008.
However, economists including myself find it unlikely that rates will continue rising significantly from where they are today. The mortgage market is certainly in a bit of disarray right now with the yield curve inverting, but that should correct itself by early next year and that’s why we generally expect rates to start pulling back from their current levels by the start of 2023.
But if rising rates are triggering memories of 2008, you wouldn’t be alone. There are some expecting that the spike in rates will trigger a surge in foreclosures and that will doom the market. But as you see here, although foreclosure filings have certainly risen, they are still remarkably low compared to historic standards.
U.S. Foreclosure Filings
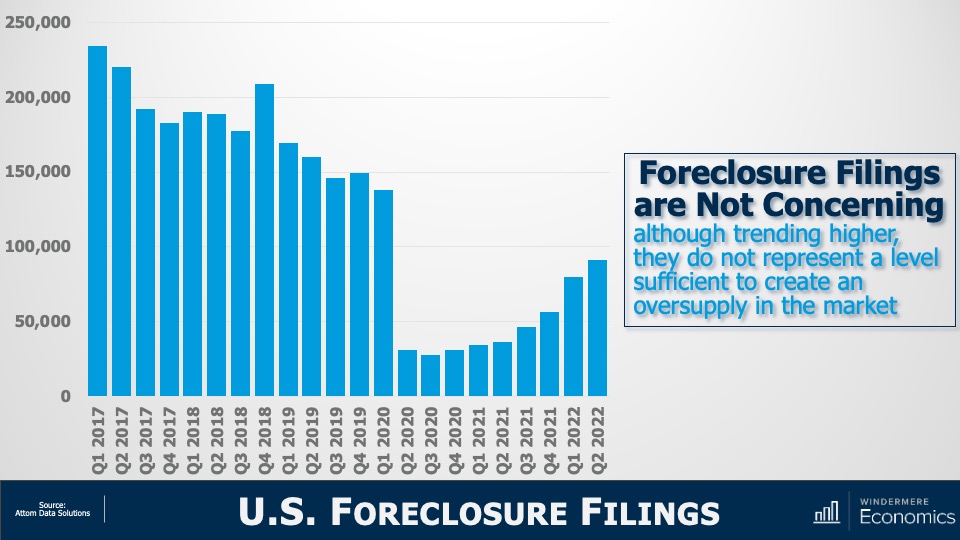
Image Source: Matthew Gardner
In the second quarter, newly delinquent mortgages represented just 1.9% of all mortgages outstanding1 and that’s the lowest share the market has seen since 2006. Although I do expect the number of homes being foreclosed on will rise as we move into 2023, I just don’t see it getting to the levels necessary to materially impact the market. And a big part of the reasoning behind my thinking is this:
Equity Rich Households (Q2 2022)
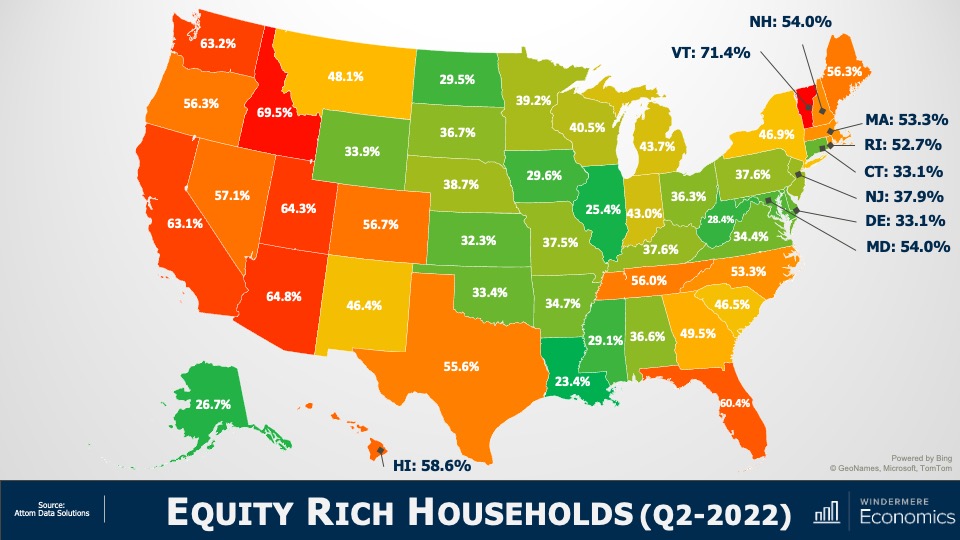
Image Source: Matthew Gardner
In the second quarter of 2022, over 48% of homeowners with a mortgage were sitting on more than 50% equity.
Simply put, for enough homeowners to be put in a negative equity situation that would lead them to enter foreclosure and materially damage the market, home prices across the country would have to fall by a percentage greater than we saw during the market crash. And I just don’t see this happening.
The word “recession” has many connotations, and when it’s used to describe the housing market, it can engender a significant level of panic. So, I will ask you all. Given the data I have showed you today, do you think that we are in a housing recession?
Yes, supply levels have risen. But they are still relatively low when compared to historic averages and with builders slowing construction activity to a crawl, it’s unlikely that housing supply will grow much organically. Over the longer term, I believe that the supply of resale homes for sale will remain below historic averages. I say this for one simple reason: mortgage rates.
In 2020, a record number of households refinanced their homes to take advantage of the mortgage rates that had been plummeting. And in 2021, over six million home buyers got mortgages with rates averaging below 3%.
I would suggest to you that we will not see the number of homes for sale even get back to normalized levels in the mid-term, as many potential sellers will decide not to sell, because if they did, they would lose the never seen before and likely never to be seen again mortgage rate that they currently have.
Of course, there will be sellers who have to move because of factors such as job relocation, death, or divorce, but I would contend that listing activity may well be tight for a long time. And if supply remains below the level of demand, the market is further protected.
And as far as demand goes, let’s not forget that the age makeup of the country suggests that we will see a lot more potential buyers as Millennials and Generation Z mature, with current numbers suggesting significant buyer demand for the next two decades.
As for sale prices, I still believe (as do almost all economists) that the median home price next year will be higher than we will see this year, but a very significant drop in the pace of sales growth is likely as we trend down to historic averages.
Of course, all real estate is local and there are markets across the country that will see prices drop in absolute terms. But even in the most highly susceptible markets, it will be a temporary phenomenon. By 2024, homeowners in these markets will see the value of their homes start to rise again.
I’m going to leave you with my quote to describe today’s market today and it’s that we are in a “housing reversion,” NOT a housing recession.
As always, I’d love to hear your comments on my thoughts so feel free to reach out. In the meantime, stay safe out there and I’ll see you all again next month.
1: New York Fed Quarterly Report on Household Debt and Credit
About Matthew Gardner
As Chief Economist for Windermere Real Estate, Matthew Gardner is responsible for analyzing and interpreting economic data and its impact on the real estate market on both a local and national level. Matthew has over 30 years of professional experience both in the U.S. and U.K.
In addition to his day-to-day responsibilities, Matthew sits on the Washington State Governors Council of Economic Advisors; chairs the Board of Trustees at the Washington Center for Real Estate Research at the University of Washington; and is an Advisory Board Member at the Runstad Center for Real Estate Studies at the University of Washington where he also lectures in real estate economics.


