Facebook
 X
X
 Pinterest
 Copy Link
The Gardner Report | Q2 2019 – Western Washington


The following analysis of the Western Washington real estate market is provided by Windermere Real Estate Chief Economist Matthew Gardner. I hope that this information may assist you with making better-informed real estate decisions. For further information about the housing market in your area, please don’t hesitate to contact me.
Economic Overview
Washington State employment jumped back up to an annual growth rate of 2.4% following a disappointing slowdown earlier in the spring. As stated in the first quarter Gardner Report, the dismal numbers earlier this year were a function of the state re-benchmarking its data (which they do annually).
The state unemployment rate was 4.7%, marginally up from 4.5% a year ago. My current economic forecast suggests that statewide job growth in 2019 will rise by 2.6%, with a total of 87,500 new jobs created.
Home Sales Activity
- There were 22,281 home sales during the second quarter of 2019, representing a drop of 4.8% from the same period in 2018. On a more positive note, sales jumped 67.6% compared to the first quarter of this year.
- Since the middle of last year, there has been a rapid rise in the number of homes for sale, which is likely the reason sales have slowed. More choice means buyers can be more selective and take their time when choosing a home to buy.
- Compared to the second quarter of 2018, there were fewer sales in all counties except Whatcom and Lewis. The greatest declines were in Clallam, San Juan, and Jefferson counties.
- Listings rose 19% compared to the second quarter of 2018, but there are still a number of very tight markets where inventory levels are lower than a year ago. Generally, these are the smaller — and more affordable — markets, which suggests that affordability remains an issue.

Home Prices
-

Year-over-year price growth in Western Washington continues to taper. The average home price during second quarter was $540,781, which is 2.8% higher than a year ago. When compared to first quarter of this year, prices were up 12%.
- Home prices were higher in every county except King, which is unsurprising given the cost of homes in that area. Even though King County is home to the majority of jobs in the region, housing is out of reach for many and I anticipate that this will continue to act as a drag on price growth.
- When compared to the same period a year ago, price growth was strongest in Lewis County, where home prices were up 15.9%. Double-digit price increases were also seen in Mason, Cowlitz, Grays Harbor, and Skagit counties.
- The region’s economy remains robust, which should be a positive influence on price growth. That said, affordability issues are pervasive and will act as a headwind through the balance of the year, especially in those markets that are close to job centers. This will likely force some buyers to look further afield when searching for a new home.


Days on Market
- The average number of days it took to sell a home matched the second quarter of 2018.
- Snohomish County was the tightest market in Western Washington, with homes taking an average of only 21 days to sell. There were five counties where the length of time it took to sell a home dropped compared to the same period a year ago. Market time rose in eight counties and two were unchanged.
- Across the entire region, it took an average of 41 days to sell a home in the second quarter of 2019. This was the same as a year ago but is down 20 days compared to the first quarter of 2019.
- As stated above, days-on-market dropped as we moved through the spring, but all markets are not equal. I suggest that this is not too much of an issue and that well-priced homes will continue to attract attention and sell fairly rapidly.

Conclusions

TO BUY NEW OR OLD, THAT IS THE QUESTION
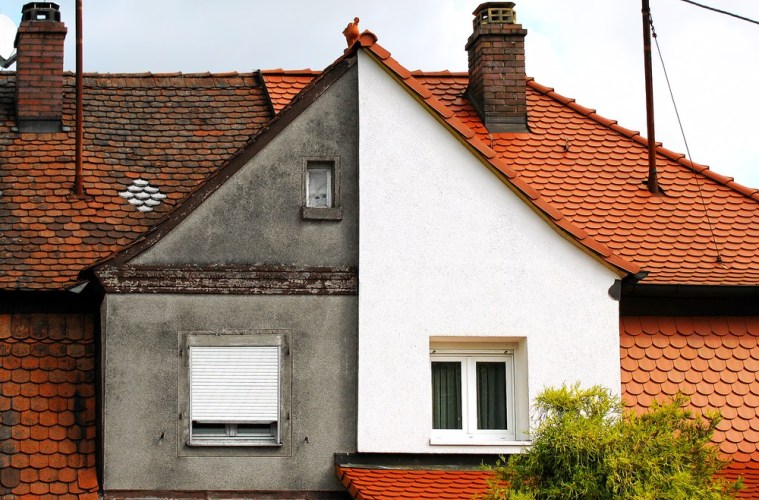
We are often asked, “Which is the better buy, a newer or older home?” Our answer: It all depends on your needs and personal preferences. We decided to put together a list of the six biggest differences between newer and older homes:
The neighborhood
Surprisingly, one of the biggest factors in choosing a new home isn’t the property itself, but rather the surrounding neighborhood. While new homes occasionally spring up in established communities, most are built in new developments. The settings are quite different, each with their own unique benefits.
Older neighborhoods often feature tree-lined streets; larger property lots; a wide array of architectural styles; easy walking access to mass transportation, restaurants and local shops; and more established relationships among neighbors.
New developments are better known for wider streets and quiet cul-de-sacs; controlled development; fewer aboveground utilities; more parks; and often newer public facilities (schools, libraries, pools, etc.). There are typically more children in newer communities, as well.
Consider your daily work commute, too. While not always true, older neighborhoods tend to be closer to major employment centers, mass transportation and multiple car routes (neighborhood arterials, highways and freeways).
Design and layout
If you like Victorian, Craftsman or Cape Cod style homes, it used to be that you would have to buy an older home from the appropriate era. But with new-home builders now offering modern takes on those classic designs, that’s no longer the case. There are even modern log homes available.
Have you given much thought to your floor plans? If you have your heart set on a family room, an entertainment kitchen, a home office and walk-in closets, you’ll likely want to buy a newer home—or plan to do some heavy remodeling of an older home. Unless they’ve already been remodeled, most older homes feature more basic layouts.
If you have a specific home-décor style in mind, you’ll want to take that into consideration, as well. Professional designers say it’s best if the style and era of your furnishings match the style and era of your house. But if you are willing to adapt, then the options are wide open.
Materials and craftsmanship
Homes built before material and labor costs spiked in the late 1950s have a reputation for higher-grade lumber and old-world craftsmanship (hardwood floors, old-growth timber supports, ornate siding, artistic molding, etc.).
However, newer homes have the benefit of modern materials and more advanced building codes (copper or polyurethane plumbing, better insulation, double-pane windows, modern electrical wiring, earthquake/ windstorm supports, etc.).
Current condition
The condition of a home for sale is always a top consideration for any buyer. However, age is a factor here, as well. For example, if the exterior of a newer home needs repainting, it’s a relatively easy task to determine the cost. But if it’s a home built before the 1970s, you have to also consider the fact that the underlying paint is most likely lead0based, and that the wood siding may have rot or other structural issues that need to be addressed before it can be recoated.
On the flip side, the mechanicals in older homes (lights, heating systems, sump pump, etc.) tend to be better built and last longer.
Outdoor space
One of the great things about older homes is that they usually come with mature tress and bushes already in place. Buyers of new homes may have to wait years for ornamental trees, fruit trees, roses, ferns, cacti and other long-term vegetation to fill in a yard, create shade, provide privacy, and develop into an inviting outdoor space. However, maybe you’re one of the many homeowners who prefer the wide-open, low-maintenance benefits of a lightly planted yard.
Car considerations
Like it or not, most of us are extremely dependent on our cars for daily transportation. And here again, you’ll find a big difference between newer and older homes. Newer homes almost always feature ample off-street parking: usually a two-care garage and a wide driveway. An older home, depending on just how old it is, may not offer a garage—and if it does, there’s often only enough space for one car. For people who don’t feel comfortable leaving their car on the street, this alone can be a determining factor.
Finalizing your decision
While the differences between older and newer homes are striking, there’s certainly no right or wrong answer. It is a matter of personal taste, and what is available in your desired area. To quickly determine which direction your taste trends, use the information above to make a list of your most desired features, then categorize those according to the type of house in which they’re most likely to be found. The results can often be telling.
If you have questions about newer versus older homes, contact your local Windermere Real Estate broker to learn more!
This post originally appeared on the Windermere.com Blog.
Local Market Update – July 2019
The market in our region appears to be moderating. Inventory is up, prices are relatively stable and homes are taking a bit longer to sell. However, with less than two months of available inventory, supply is still far short of demand. Steady buyer activity, low interest rates and a thriving economy are making for a strong summer in the housing market.
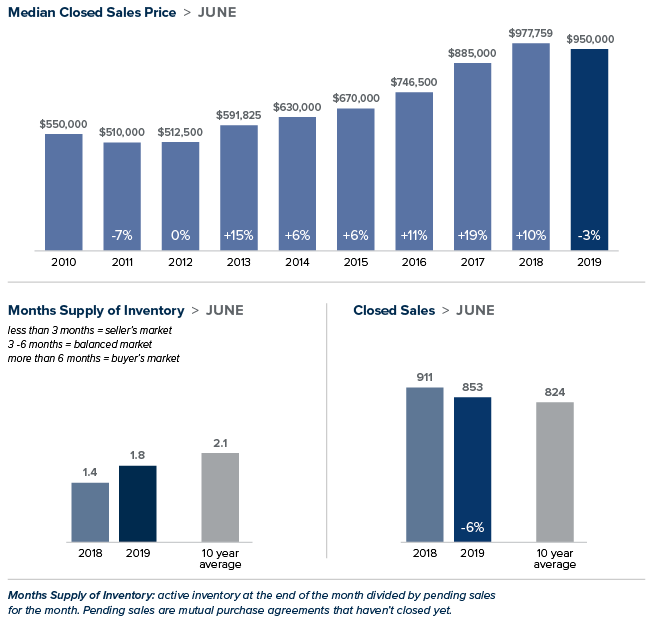
Eastside
>>>Click image to view full report.
The median price of a single-family home on the Eastside was $950,000 in June, down 3% from the same time last year and up $21,000 from May. Many buyers are looking to take advantage of the Eastside jobs boom with Amazon announcing plans to build a 43-story tower in Bellevue and Google expecting to reach 1 million square feet of office space in Kirkland.
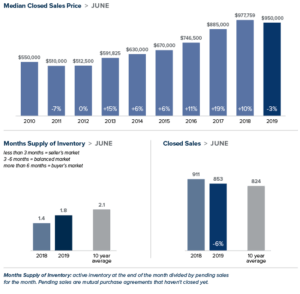
King County
>>>Click image to view full report.
There was good news for buyers in June as a growing supply of homes helped boost inventory close to 2012 listing levels. The median price of a single-family home in King County was $695,000. That figure is a 3% drop from a year ago and virtually unchanged from May. 33% of homes sold above list price; another sign prices are moderating when compared to 52% of homes sold over list price this time last year.
Seattle
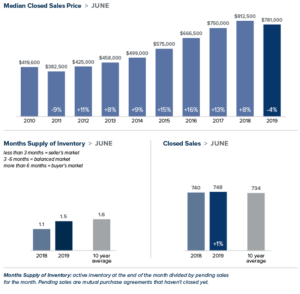
>>>Click image to view full report.
Home inventory in Seattle inched slightly higher in June. However, with less than two months of supply, the city is still a solid seller’s market. Apple’s plan to turn Seattle into a key engineering hub can only add to demand. The median price of a single-family home in Seattle was $781,000, down 4% from a year ago and nearly unchanged from May.
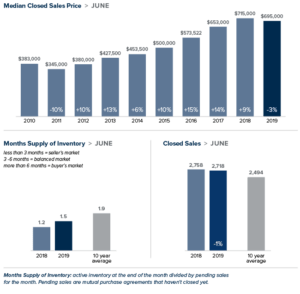
Snohomish County
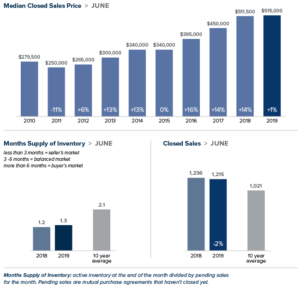
>>>Click image to view full report.
After hovering around $500,000 since March, home prices in Snohomish County crept up in June. The median price of a single-family home was $515,500, as compared to $511,500 last June. Snohomish County continues to attract buyers priced out of the King County market, putting an additional strain on supply which stands a just 1.5 months of inventory.
This post originally appeared on the GetTheWreport.com.